The value of free water: Analyzing South Africa’s Free Basic Water Policy
In this project Andrea Szabo studies South Africa’s Free Basic Water Policy, under which households receive a free water allowance, and asks whether the pricing system could be improved.
Background
Water pricing is a salient issue in post-Apartheid South Africa, where who has access to water and how much they are charged for it is closely tied to issues of social justice. After the democratic transition in 1994, every household’s right to a monthly allowance of free water was codified in the constitution, leaving the details of implementation to be worked out by future governments. The resulting unique pricing scheme, the Free Basic Water Policy, was introduced in 2001 and provides 6 kiloliters of water per month at no cost to households, regardless of income or household size.
This study estimates water demand in in a particularly disadvantaged suburb in Tshwane (the metropolitan area around Pretoria). The goal is to understand how a low-income population responds to water prices, including the free allowance, in a setting where water is a nontrivial expenditure (between 2-20% of monthly household income).
Study design
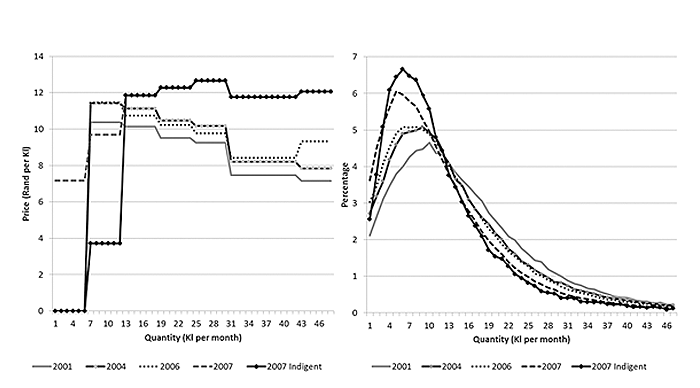
The study uses a large dataset containing seven years of monthly meter reading data for every household served by a local water provider (about 60,000 households). During this period, consumers were subject to several different pricing schedules, including schedules with or without a free allowance for some groups of households. To estimate water demand under the complex block pricing systems used in Tshwane, the study adapts an estimation method originally developed to study labor supply. The method is adapted to handle various technical difficulties, including the presence of both increasing and decreasing block prices.
Findings
The results show that, in this context where water spending is a large fraction of household income, consumers are responsive to the complex pricing schedules used by the provider. Across all households, the paper estimates an average price elasticity of −0.98. This price sensitivity underscores the usefulness of price-based instruments to regulate water consumption in this setting.
In analyzing the effect of the free allowance, the paper finds that household consumption would change very little if the allowance was removed. In this sense, the policy acts as a lump-sum cash subsidy to the households. However, we also find that it is possible to improve household welfare without lowering the utility’s profit by using different pricing schemes. The optimal tariff spreads the current government subsidy more evenly across lower segments of the pricing schedule. It features unit prices gradually increasing with the consumed quantity, and no free allowance.
Many consumers currently attempt to stay within the free water allowance in order to avoid paying the higher unit prices. The optimal tariff schedule without the free allowance would eliminate this incentive, and would actually reduce the fraction of consumers with very low water consumption.
Relative to the tariffs used in practice, the optimal price schedule derived here yields an estimated welfare gain for the median household that is equivalent to 10–20% of the amount spent on water. In fact, removing the free allowance can improve welfare even for the lowest income consumers. In this sense, the high unit prices made necessary by giving out the lowest quantities for free unintentionally hurts these households.
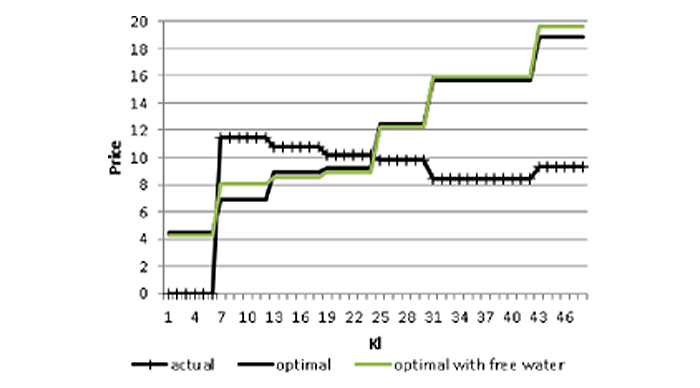
2006/2007 tariff and the corresponding optimal tariffs with and without 6 kl free water for indigent
households. The marginal cost is set to 8.2 Rand. The “optimal with free water” schedule shown
is for non-indigent households..