
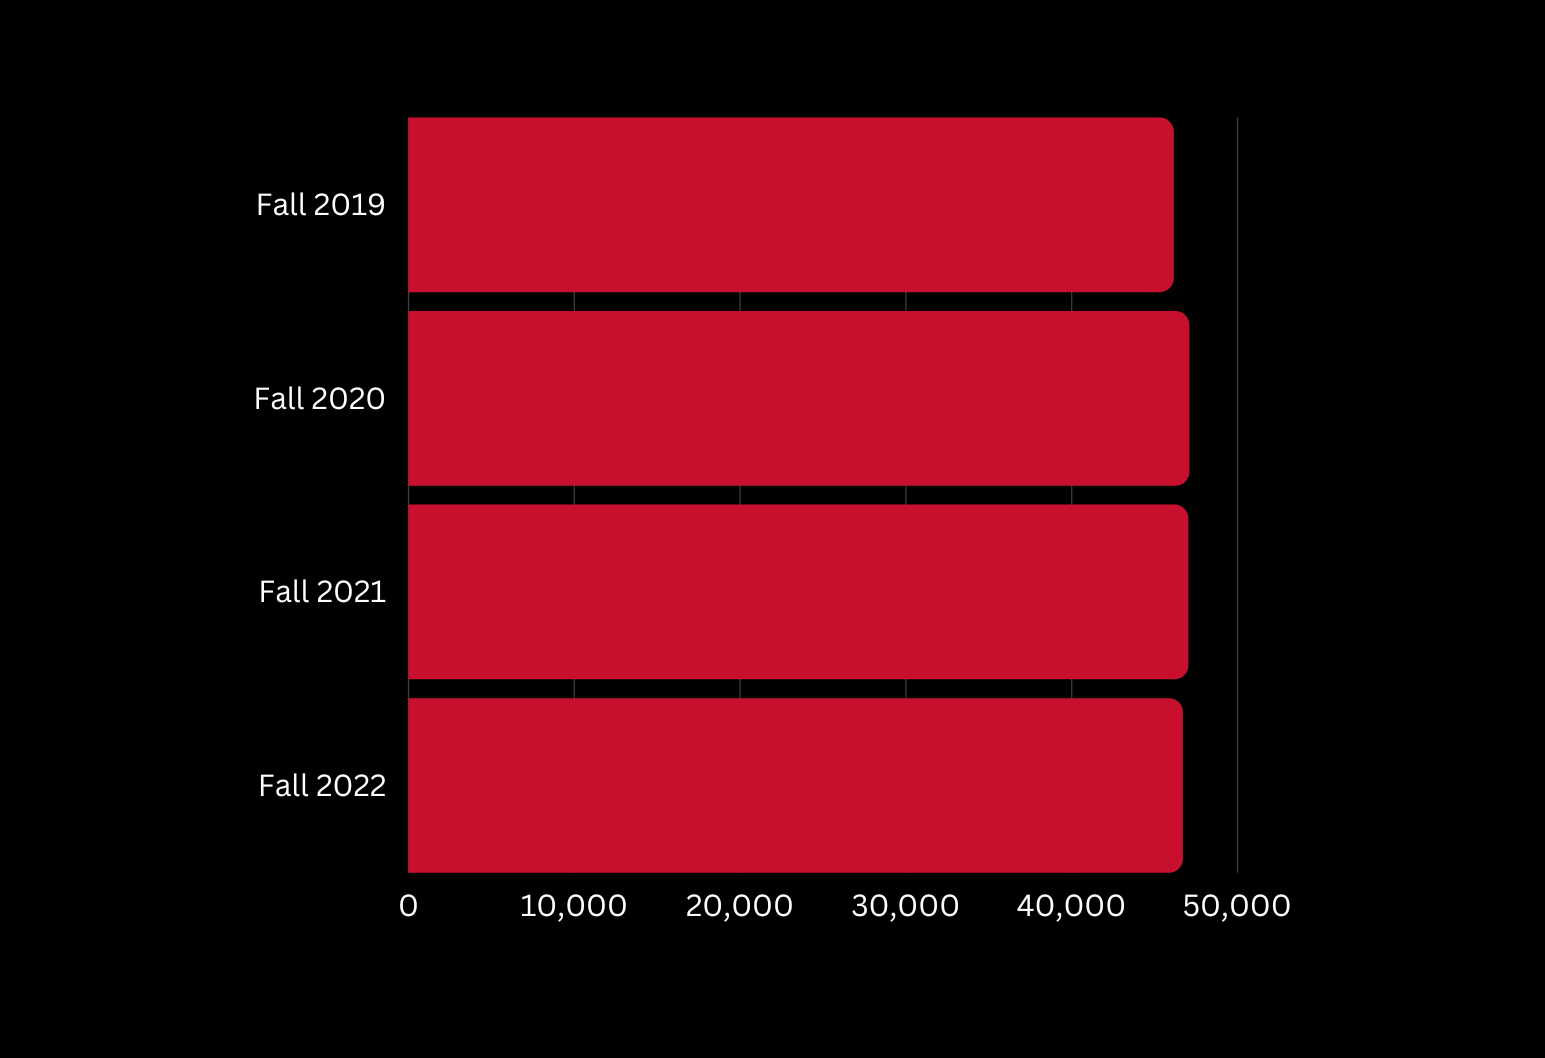
During the timeframe depicted in the enrollment graph spanning from 2019 to 2023, our institution faced the formidable challenge of a global pandemic. While our enrollment remained steady throughout this duration, it is noteworthy that we managed to avert a decline. In addition to challenges posed directly by Covid 19 in enrollment, the pandemic also had a dramatic effect on the enrollment of students into the community colleges that have made up a large percentage of new students at UH every year. Another factor making this enrollment outcome all the more impressive has been the impending ‘enrollment cliff.’ This refers to a dramatic drop in the number of high-school students expected to graduate and enroll in college every year, shrinking the pool of possible future students for institutions across the country to enroll. However, as emphasized by President Renu Khator in her Fall Address, “Against all odds, the University of Houston successfully welcomed over 47,000 students in the Fall.” This achievement holds weight, given the numerous universities grappling with diminishing enrollment due to Covid fatigue. The unswerving enrollment of our university stands as a remarkable accomplishment amidst the pandemic's impact, symbolizing resilience, and determination.