Texas 2016 Presidential Election Survey
Interviews were conducted by Consumer Research International between October 7 and October 15, 2016. Interviews were conducted on landline (54 percent) and cell phones (46percent).
The margin of error for the survey is +/- 3 percent (at the 95 percent confidence level). The survey was conducted under the supervision of co-directors Richard Murray, director of the Hobby School’s Survey Research Institute, and Robert Stein, research associate at the Hobby School.
The sample was weighted to reflect the racial and ethnic composition of the electorate based on the 2008 and 2012 presidential elections.
A. Presidential Candidate Support in Texas
|
Candidate |
Support |
|
Trump |
41% |
|
Clinton |
38% |
|
Johnson |
4% |
|
Stein |
1% |
|
None |
3% |
|
Don't know |
11% |
|
Refused |
2% |
- Donald Trump leads Hillary Clinton by 3 points in the presidential election among Texas voters.
- The Trump lead of 3 percent is statistically significant.
- Since 2000, no Republican presidential candidiate has failed to carry Texas by less than 11 percent points.
B. Presidential Candidate Support by Partisan Identification
|
Candidate |
Democrat |
Independent |
Republican |
|
Trump |
2% |
14% |
78% |
|
Clinton |
80% |
30% |
5% |
|
Johnson |
2% |
13% |
5% |
|
Stein |
1% |
4% |
0% |
|
None |
2% |
4% |
3% |
|
Don't know |
11% |
29% |
8% |
|
Refused |
1% |
10% |
1% |
- Eighty percent of self-identified Democrats voters are voting for Clinton, compared to 78 percent of self-identified Republicans who are voting for Trump.
- Among Republican voters, 5 percent are voting for Clinton while 2 percent of Democratic voters are voting for Trump.
- Eleven percent of Democrats are undecided about who to vote for in November’s presidential contest. Only 9 percent of Republicans are undecided.
- More than a quarter (29 percent) of all independents are undecided about who they will vote for in the presidential contest.
- Among independents, Clinton leads Trump 30 percent to 14 percent.
- Third party candidates Johnson (13 percent) and Stein (4 percent) are receiving 17 percent of the independent vote.
C. Presidential Candidate Support by Gender
|
Candidate |
Male |
Female |
|
Trump |
44% |
38% |
|
Clinton |
35% |
42% |
|
Johnson |
4% |
3% |
|
Stein |
1% |
1% |
|
None |
4% |
2% |
|
Don't know |
9% |
14% |
|
Refused |
3% |
1% |
- Men favor Trump (44 percent) over Clinton (35 percent).
- Women favor Clinton (42 percent) and Clinton (38 percent).
D. Support for Presidential Candidates
by Likelihood of Voting in November’s Election
|
Candidate |
Certain to vote |
Very likely to vote |
|
Trump/Pence |
42% |
37% |
|
Clinton/Kaine |
38% |
37% |
|
Johnson/Weld |
4% |
3% |
|
Stein/Baraka |
1% |
1% |
|
None |
3% |
3% |
|
Don't know |
9% |
17% |
|
Refused |
2% |
2% |
- Trump leads Clinton by 4 percent among voters who are certain to vote in November. Trump and Clinton are tied (37 percent) among voters who are very likely to vote in November.
E. How would you rate Donald Trump and Hillary Clinton?
|
Candidate |
Trump |
Clinton |
|
Very Favorable |
19% |
23% |
|
Somewhat Favorable |
21% |
18% |
|
Somewhat Unfavorable |
8% |
7% |
|
Very Unfavorable |
48% |
47% |
|
No opinion |
4% |
4% |
|
Don't know the person |
0% |
0% |
|
Refused |
1% |
1% |
- Clinton is rated very unfavorably by 47 percent of Texas voters.
- Trump is rated very unfavorably by 48 percent of Texas voters.
F. Which candidate will do a better job handling?
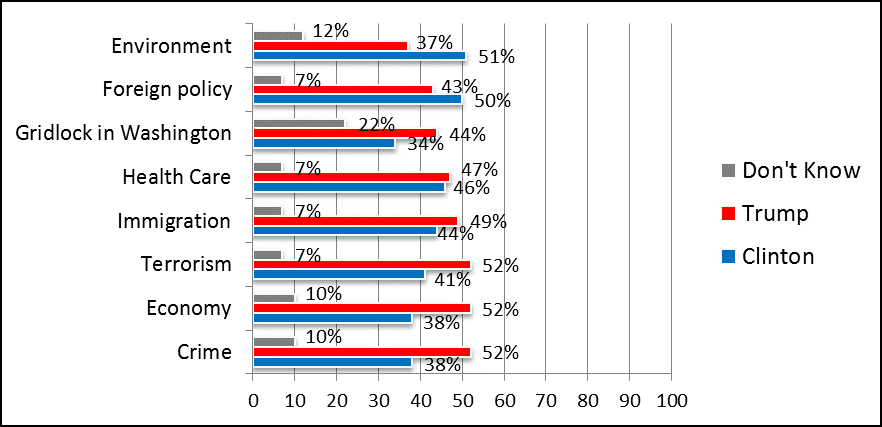
- Texas voters believe Republican Donald Trump will do a better job on immigration (49 percent), fighting terrorism (52 percent) and crime (52 percent), managing the economy (51 percent), and ending gridlock in Washington (44 percent) than Hillary Clinton (34 percent).
- Texas voters believe Clinton will do a better job protecting the environment (50 percent) and handling foreign policy (48 percent) than Donald Trump.
G. Who do you think will be the next President of the United States?
|
Candidate |
Democrat |
Independent |
Republican |
All Voters |
|
Hillary Clinton |
82% |
55% |
27% |
53% |
|
Donald Trump |
2% |
9% |
42% |
23% |
|
Someone else |
1% |
5% |
1% |
1% |
|
Do you not know |
15% |
29% |
29% |
23% |
|
Refused |
1% |
2% |
1% |
1% |
- Fifty-three percent of Texas voters believe Hillary Clinton will be our nation’s next president. Only 23 percent of all Texas voters believe Donald Trump will be elected president.
- Less than half (42 percent) of Texas Republicans believe Donald Trump will be elected president.
H. How frequently do persons vote illegally?
|
Democrat |
Independent |
Republican |
All Voters |
|
|
It is very common |
8% |
11% |
28% |
18% |
|
It occurs occasionally |
10% |
16% |
34% |
23% |
|
It occurs infrequently |
15% |
16% |
15% |
15% |
|
It almost never occurs |
55% |
30% |
10% |
30% |
|
Don't Know |
13% |
27% |
12% |
13% |
|
Refuse |
0% |
0% |
0% |
0% |
- Eighteen percent of Texas voters believe it is very common that people in Texas who are not legally eligible to vote are indeed voting.
- Thirty percent of Texas voters believe illegal voting almost never occurs.
- Nearly two-thirds (62 percent) of Republican voters are more likely to believe that persons voting illegally is either very common or occurs occasionally.
- Fifty-five percent of Democratic voters believe persons voting illegally almost never occurs.
I. Is a government issued photographic ID required to vote in Texas?
|
Anglo |
African- American |
Hispanic |
Asian |
Other |
All Voters |
||
|
Yes, it is required |
42% |
47% |
49% |
59% |
52% |
44% |
|
|
Not required |
30% |
13% |
19% |
10% |
20% |
26% |
|
|
Don't know |
28% |
39% |
31% |
31% |
28% |
29% |
|
|
Refuse |
1% |
1% |
0% |
0% |
0% |
1% |
|
- Forty-four percent of voters in Texas believe a government issued photographic identification is required to vote in this November’s presidential election in Texas.
- Twenty-nine percent of voters don’t know if a photo ID is required to vote.
- Twenty-five percent of registered voters in Texas correctly know that a government issued photo ID is not required to vote in this November’s Texas election.
- Anglos (42 percent) are significantly more likely than African-American, Hispanic, and Asian voters (47 percent, 49 percent, and 59 percent respectively) to know that a government issued photo ID is not required to vote in this November’s election.
In the Media
RealClear: Texas: Trump vs. Clinton vs. Johnson vs. Stein
The Hill: Poll: Trump's lead narrows to 3 in Texas
CNBC: Texas looks like a battleground as Clinton pulls within 3 points of Trump: Poll
KURV: UH Poll: Trump Lead Over Clinton Down To 3 Points In Texas
The Week: Clinton is within the margin of error of Trump in Texas. TEXAS!
Chron: UH Poll: Donald Trump Leads Hillary Clinton By 3 percentage points in Texas
FiveThirtyEight: Election Update: Clinton's Texas Opportunity (And Her Texas Problem)
CNN: Once a fan, Trump declares: 'I don't believe the polls anymore'
Houston Chronicle: Local undecided voters may stay home
The Washington Post: Could Hillary Clinton actually win Texas?
Houston Chronicle: Lone Star Surprise?: Polls show Trump's advantage shrinking in Texas
MSNBC: Trump says race looks 'pretty good,' but latest polls disagree
TIME: Here Are the Unlikely States Where Hillary Clinton Is Polling Better Than Expected
Texas Monthly: The State of Texas: New Polls Show Donald Trump's Lead In Texas Is Smaller Than Ever
Fox News: Trump's path to presidency narrows - upping pressure to tilt race at debate