2022: UH-TSU Texas Trends Survey
Report One. Texas Trends Survey 2022: Election
The 2022 Texas Trends Survey conducted by the Hobby School of Public Affairs and the Executive Master of Public Administration Program in the Barbara Jordan-Mickey Leland School of Public Affairs at Texas Southern University focuses on opinions about the candidates for the top three statewide races and about significant issues important to the Lone Star State. The results of this survey will be presented in five separate reports: the election, gun safety, the economy, criminal justice and healthcare.
The first report of the 2022 Texas Trends Survey examines Texans’ preferences for the candidates running for governor, lieutenant governor and attorney general.
The survey was fielded Aug. 11-29, 2022 in English and Spanish, with 2,140 YouGov respondents 18 years of age and older, resulting in a confidence interval of +/-2.1. The respondents were matched to a sampling frame on gender, age, race/ethnicity, and education and are representative of the Texas adult population.
While the population examined in the four issue reports includes all Texans 18 years of age and older, the election-related report focuses on the 1,312 likely voters (confidence interval of +/- 2.7%), and, to a much lesser extent, on a subset of these likely voters, the 1,012 (confidence interval of +/- 3.1%) who said that they were almost certain to vote, rather than only being very or somewhat likely to vote.
In addition to the five statewide reports, the 2022 Texas Trends survey also looks at the race for county judge in Harris County, the nation’s third largest county and Texas’ largest. This county-specific election study is presented as the second report in the overall series.
Highlights
The Race for Governor
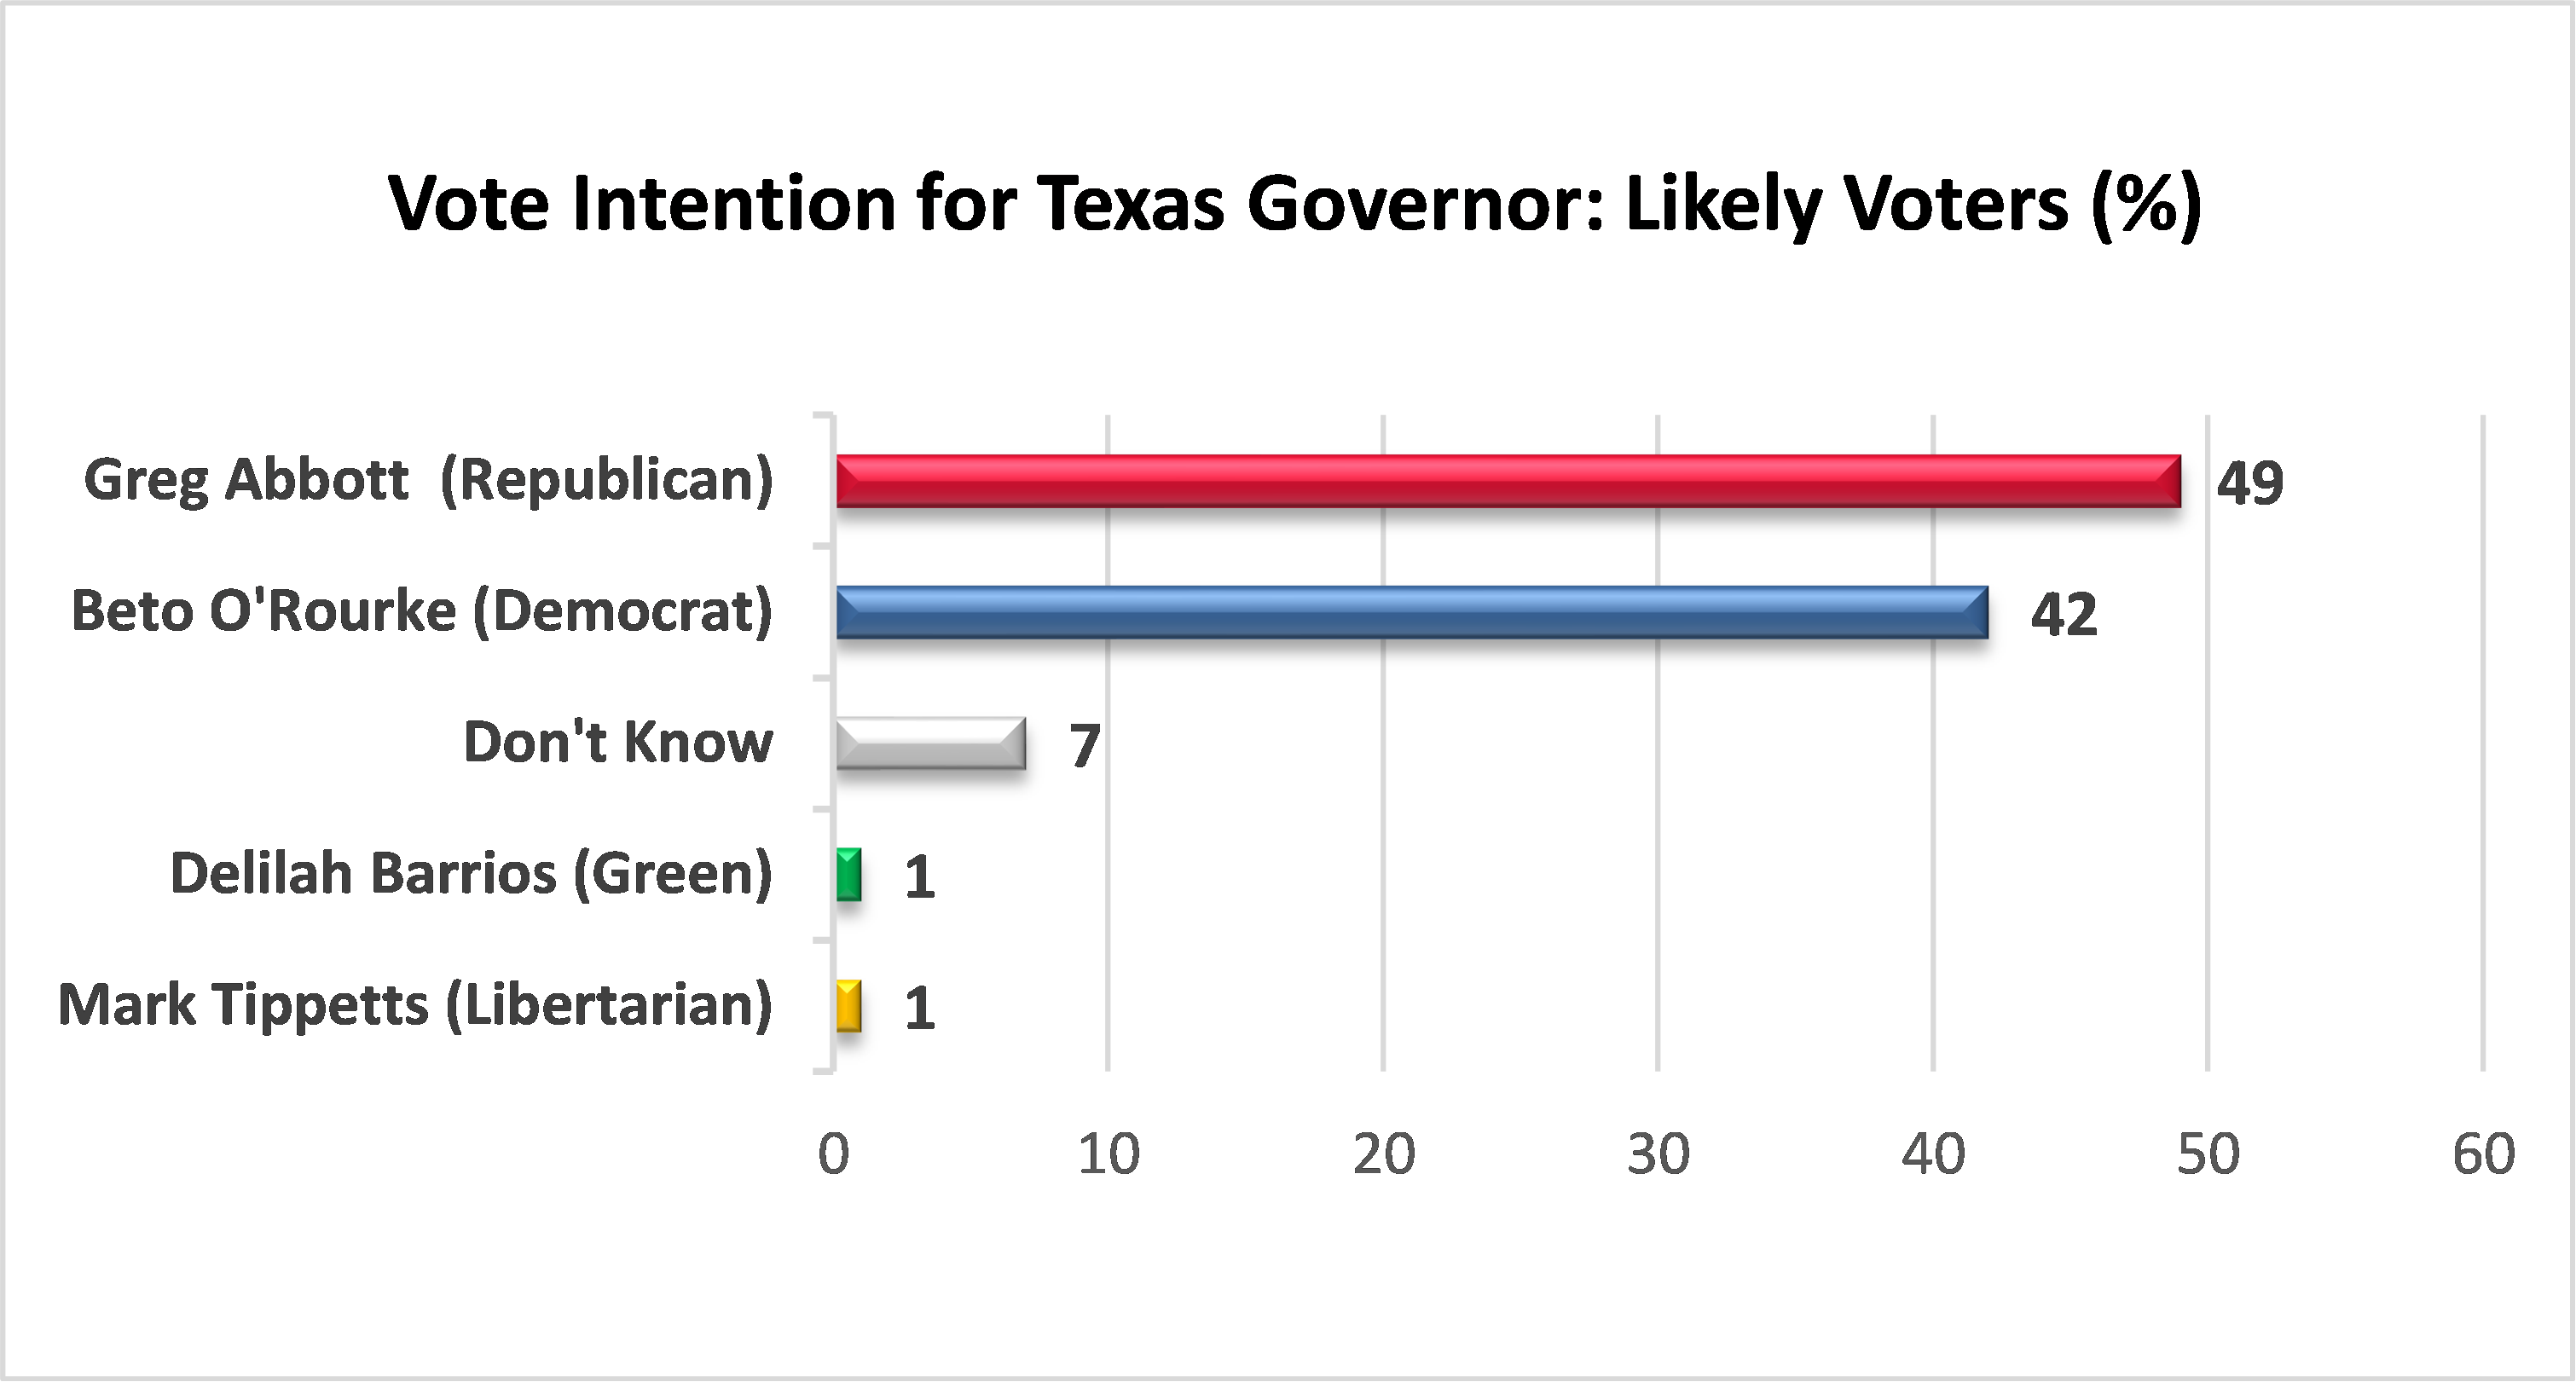
- In the race for governor, Republican Greg Abbott leads Democrat Beto O’Rourke by 7% among likely voters, 49% to 42%, with 7% undecided and 1% intending to vote for Libertarian Mark Tippetts and 1% for the Green Party’s Delilah Barrios.
- Abbott holds a 29% (61% to 32%) lead over O’Rourke among white voters while O’Rourke holds a 57% (72% to 15%) lead over Abbott among Black voters, a 15% (53% to 38%) lead among Latino voters and a 9% (48% to 39%) lead among those voters with a mixed or other ethnic/racial identity.
- Abbott and O’Rourke are deadlocked at 45% among women voters, while Abbott enjoys an 18% (55% to 37%) lead over O’Rourke among men.
- Older Texans belonging to the Silent Generation/Baby Boomer cohort and to Generation X favor Abbott over O’Rourke by margins of 28% (61% to 33%) and 11% (51% to 40%) respectively. O’Rourke is the candidate of choice among Millennials and Generation Z by margins of 21% (55% to 34%) and 23% (54% to 31%) respectively.
The Race for Lieutenant Governor
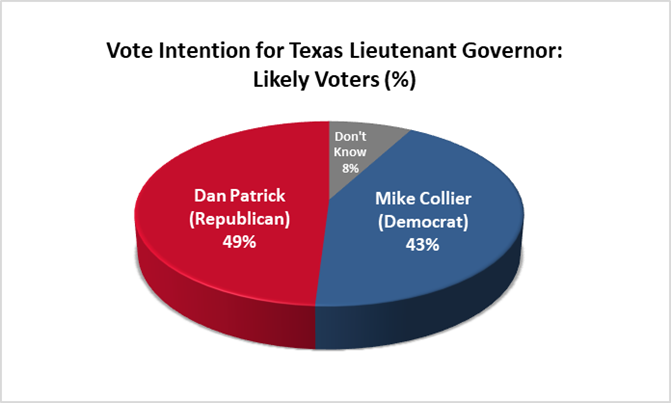
- In the race for lieutenant governor, Republican Dan Patrick leads Democrat Mike Collier by 6% among likely voters, 49% to 43%, with 8% undecided.
- Patrick holds a 26% (60% to 34%) lead over Collier among white voters while Collier holds a 63% (78% to 15%) lead over Patrick among Black voters, a 14% (51% to 37%) lead among Latino voters and a 5% (44% to 39%) lead among those voters with a mixed or other ethnic/racial identity.
- Collier holds a narrow 1% lead over Patrick among women voters (46% to 45%) while Patrick enjoys a 15% (54% to 39%) lead over Collier among men.
- Older Texans belonging to the Silent Generation/Baby Boomer cohort and to Generation X favor Patrick over Collier by margins of 26% (60% to 34%) and 11% (52% to 41%) respectively. Collier is the candidate of choice among Millennials and Generation Z by margins of 20% (55% to 35%) and 28% (55% to 27%) respectively.
The Race for Attorney General
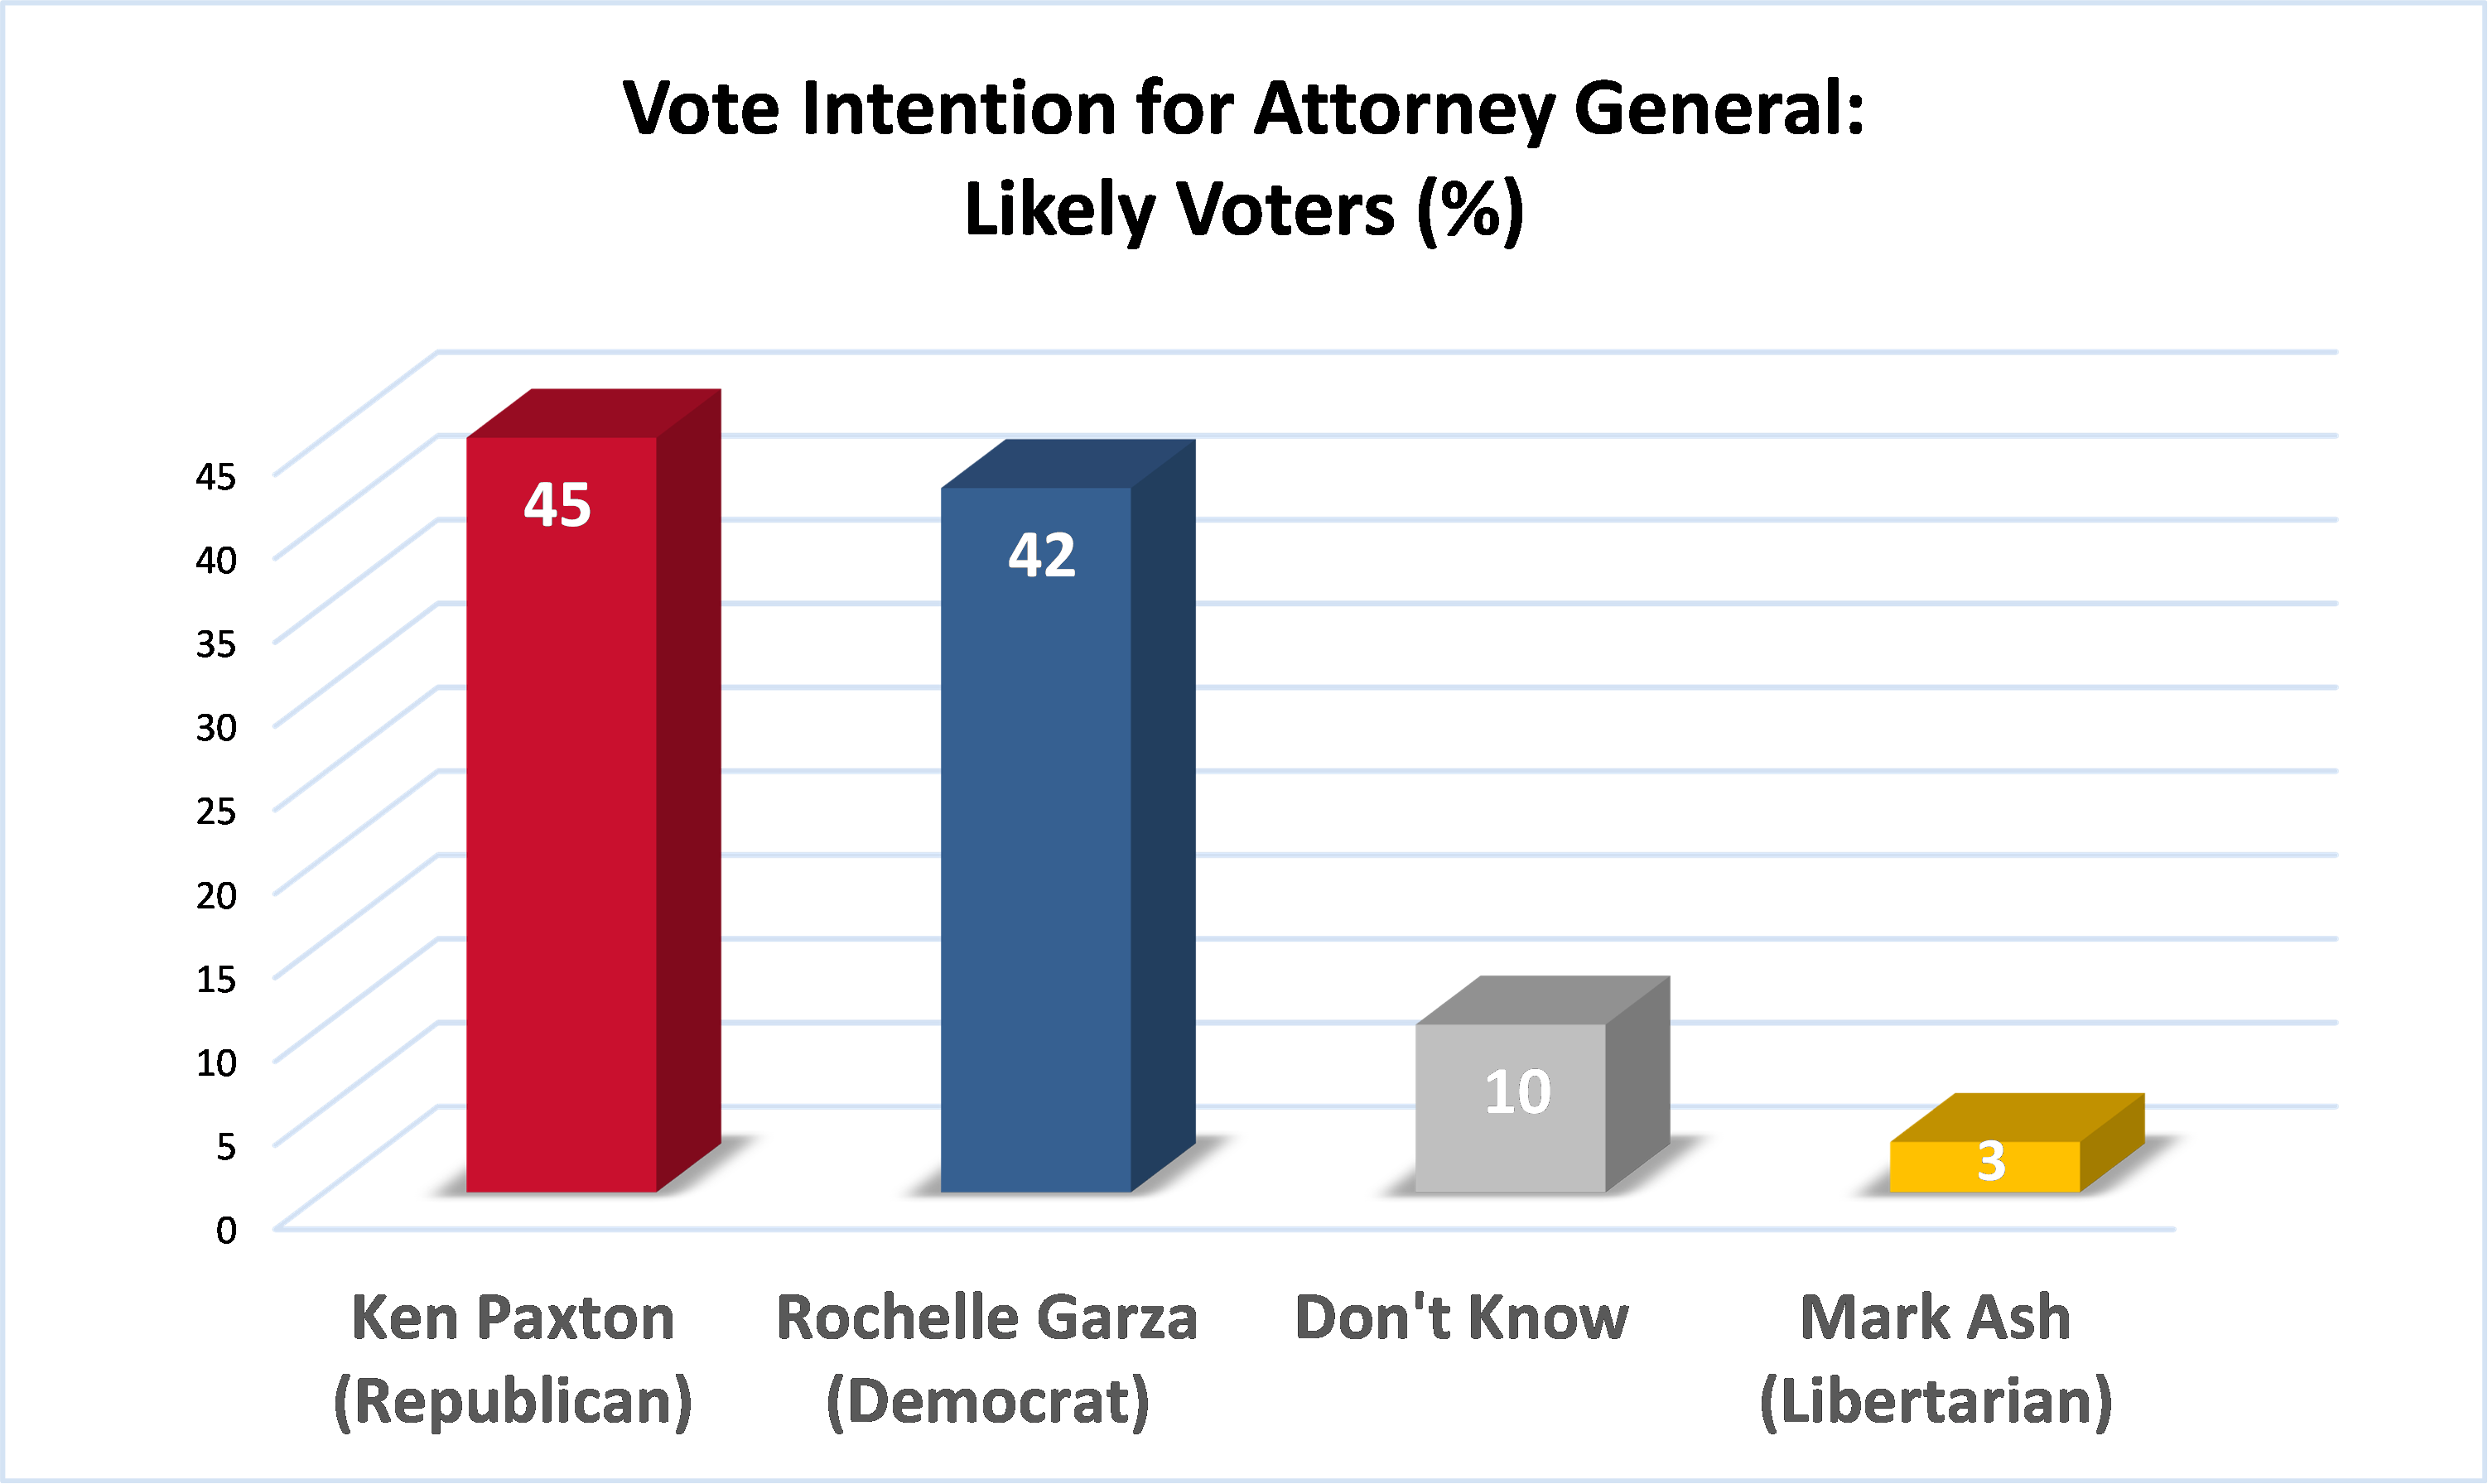
- In the race for attorney general, Republican Ken Paxton leads Democrat Rochelle Mercedes Garza by 3% among likely voters, 45% to 42%, with 10% undecided and 3% intending to vote for Libertarian Mark Ash.
- Paxton holds a 23% (56% to 33%) lead over Garza among white voters while Garza holds a 61% (75% to 14%) lead over Paxton among Black voters, a 16% (51% to 35%) lead among Latino voters, and a 15% (45% to 30%) lead among those voters with a mixed or other ethnic/racial identity.
- Garza holds a 5% lead over Paxton among women voters (45% to 40%) while Paxton enjoys a 13% (51% to 38%) lead over Garza among men.
- Older Texans belonging to the Silent Generation/Baby Boomer cohort and to Generation X favor Paxton over Garza by margins of 22% (55% to 33%) and 10% (49% to 39%) respectively. Garza is the candidate of choice among Millennials and Generation Z by margins of 22% (55% to 33%) and 31% (55% to 24%) respectively.
Read Report One to learn more about where likely voters in Texas stand on the 2022 candidates for governor, lieutenant governor and attorney general.
Media Release September 7, 2022
Report Two. Texas Trends Survey 2022: Harris County
In addition to the statewide election analysis of likely voters, the 2022 Texas Trends survey looks at the race for county judge in Harris County, the nation’s third largest county and Texas’ largest, with a population of more than 4.5 million residents.
While the non-election related reports we will subsequently release focus on all Harris County adults aged 18 years and older, this county-specific election report is based on the analysis of a sample population of 195 likely voters, with a confidence interval of +/- 7.0%. Given the small size of this population, caution should be used in interpreting the results due to the comparatively large margin of errors surrounding all of the estimates.
This county-specific election study is presented as the second report in the overall series, and it includes the preferences for candidates running for governor, lieutenant governor and attorney general in addition to county judge.
Highlights
- The vote intention in the race for Harris County judge is 52% for Democrat Lina Hidalgo and 42% for Republican Alexandra del Moral Mealer, with 6% undecided.
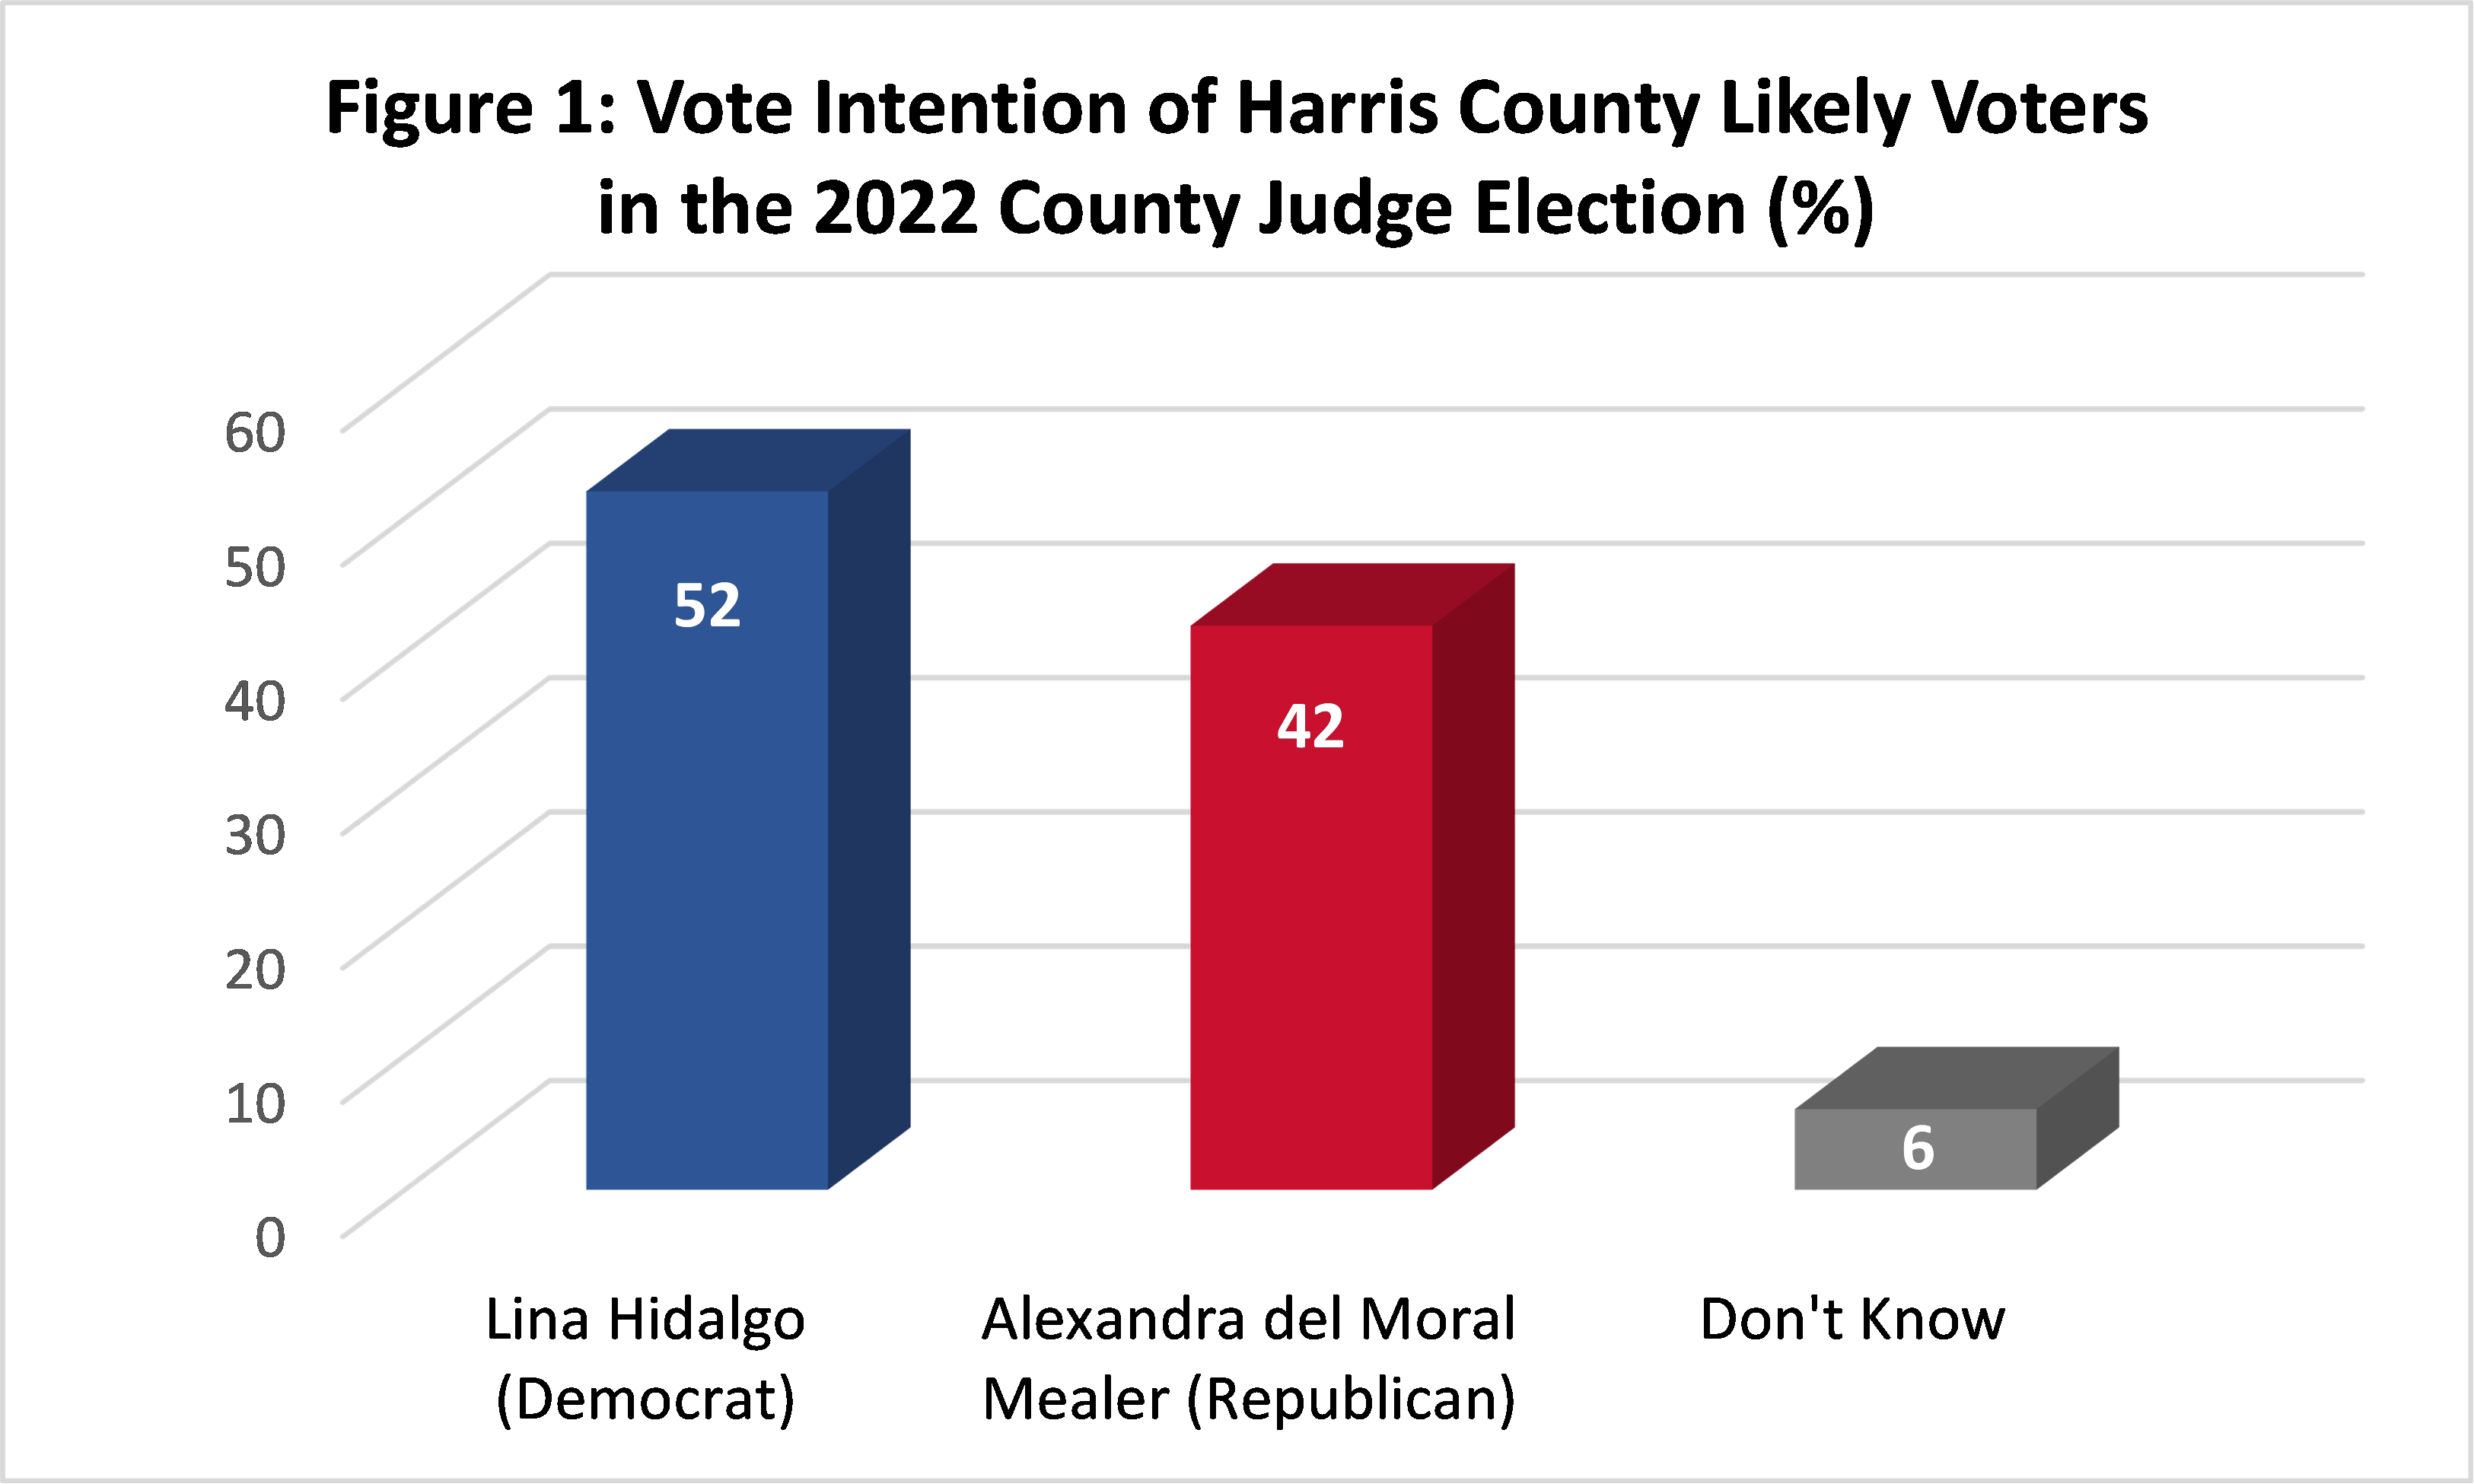
- This 10 percentage point lead by Hidalgo is notably higher than the 1 percentage point lead she garnered in the Hobby School election survey released in July.
- Del Moral Mealer holds a 19 percentage point advantage over Hidalgo among white voters, 58% to 39%.
- Hidalgo holds a 71 percentage point advantage over del Moral Mealer among Black voters, 79% to 8%, and a 44 percentage point advantage among Latino voters, 69% to 25%.
- Hidalgo enjoys a 14 percentage point lead over del Moral Mealer among women, 53% to 39%, but only a 2 percentage point lead among men, 50% to 48%.
- Del Moral Mealer enjoys a 16 percentage point lead over Hidalgo, 56% to 40%, among the combined Silent Generation/Baby Boomers cohort, and Hidalgo a comparable 16 percentage point lead over del Moral Mealer among Generation X, 54% to 38%.
- Hidalgo is the overwhelming favorite of the combined Millennials/Generation Z cohort, with a 40 percentage point lead in vote intention over del Moral Mealer, 67% to 27%.
Read Report Two to learn more about where likely voters in Harris County stand on the 2022 candidates for county judge, governor, lieutenant governor and attorney general.
Report Three. Texas Trends Survey 2022: Gun Safety
The survey module on gun safety includes opinions of 2,140 YouGov respondents 18 years of age and older, resulting in a confidence interval of +/-2.1. The respondents were matched to a sampling frame on gender, age, race/ethnicity, and education and are representative of the Texas adult population.
Highlights
10 Proposals to Reduce Gun Violence
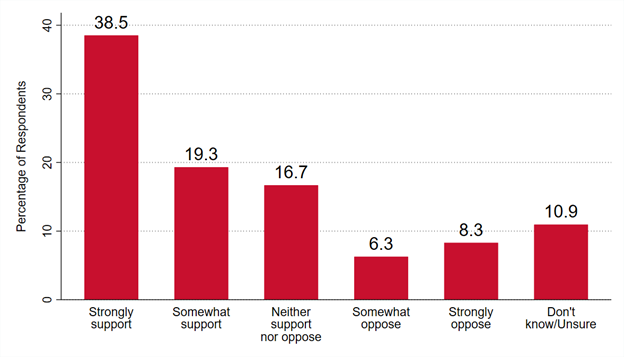
A majority of Texans across demographic and partisan lines support a variety of gun reform proposals seeking to reduce violence in the Lone Star State. Majorities strongly and somewhat supporting the following 10 potential reforms are shown in Figure 1:
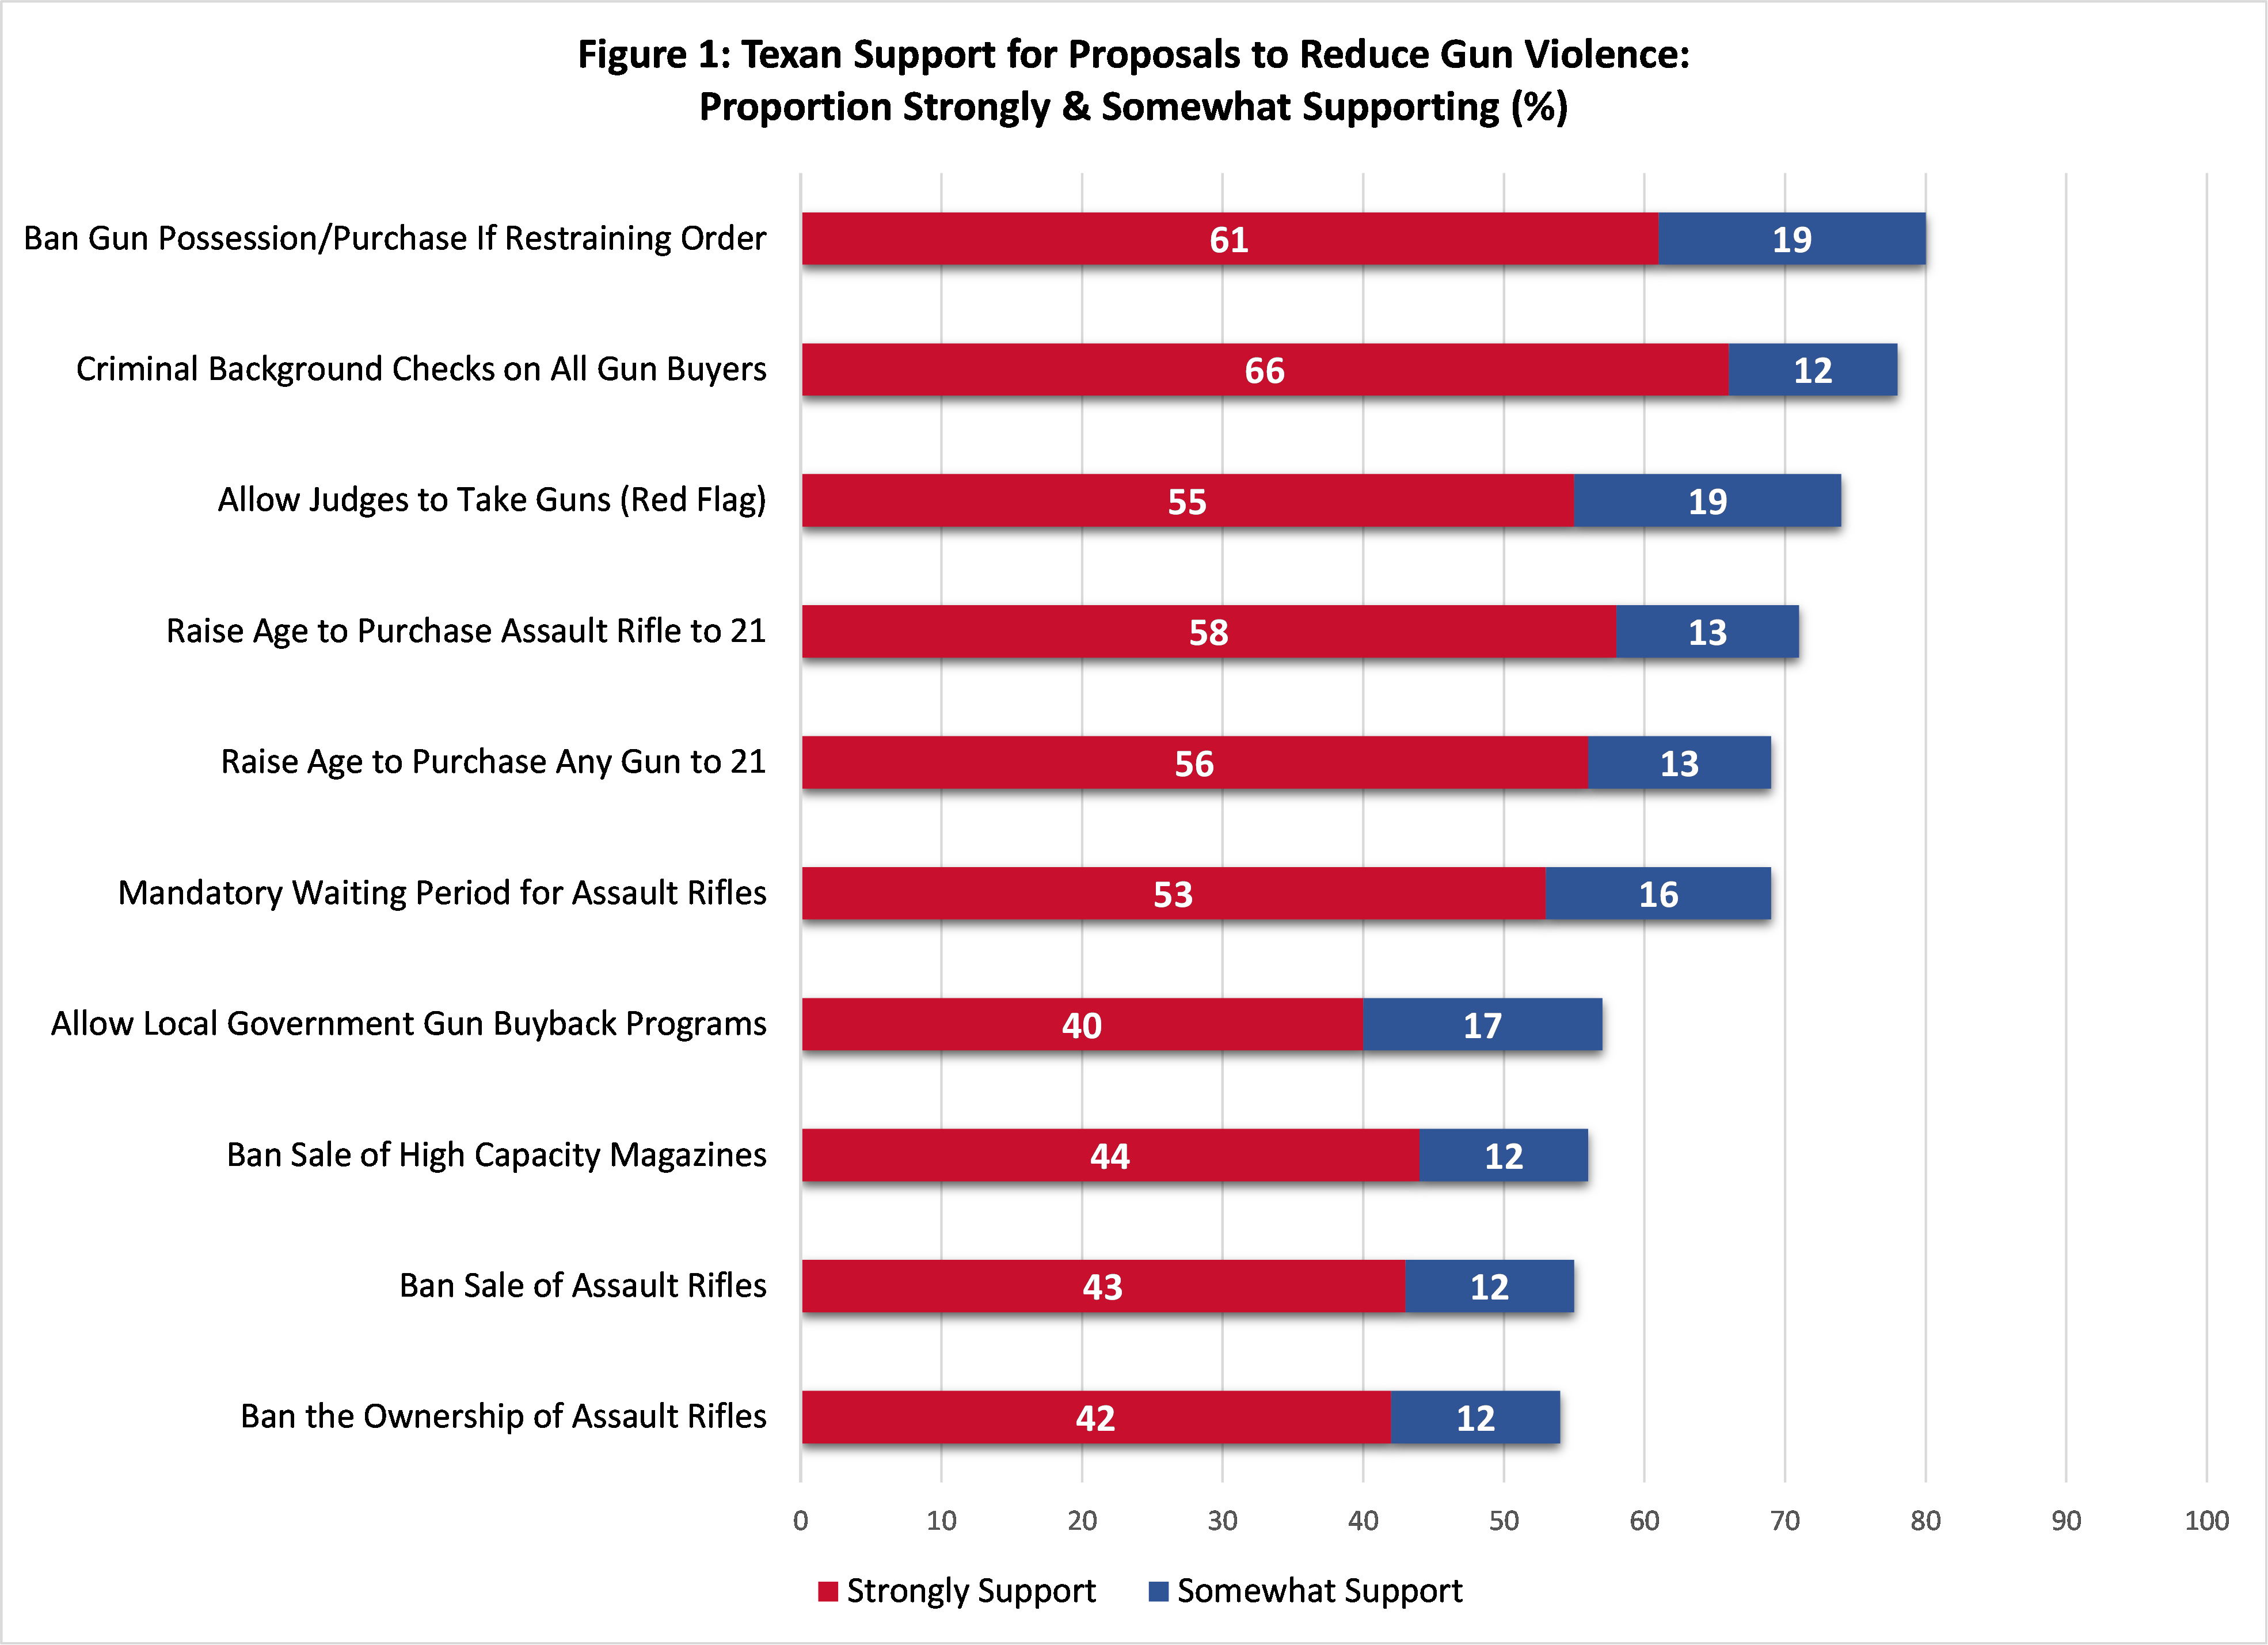
- 80% of Texans support a ban on anyone with a restraining order filed against them for stalking or domestic violence from possessing or purchasing a gun.
- 78% of Texans support requiring criminal background checks on all gun buyers, including those purchasing at gun shows and private sales.
- 74% of Texans support allowing judges to take guns from people who pose a threat to themselves or others.
- 71% of Texans support raising the age to purchase an assault rifle from 18 to 21.
- 69% of Texans support raising the age to purchase any gun from 18 to 21.
- 69% of Texans support establishing a waiting period between the time a person purchases an assault rifle and when they receive it.
- 57% of Texans support allowing local governments to conduct gun buyback programs.
- 56% of Texans support a ban on the sale of high capacity magazines.
- 55% of Texans support a ban on the sale of assault rifles.
- 54% of Texans support a ban on the ownership of assault rifles.
- Across all ethnicities and races, women are generally much more likely than men to support these gun control proposals.
- Black Texans are on average significantly more supportive of these gun control proposals than are both Latino and white Texans, while Latino Texans are on average significantly more supportive than are white Texans.
The Federal Bipartisan Safer Communities Act
The survey respondents were asked about their level of support for or opposition to five principal components of the 2022 Bipartisan Safer Communities Act, which was approved by Congress and signed into law by President Joe Biden in June 2022.
- Support among Texans for the main components of the 2022 Bipartisan Safer Communities Act range from 59% to 75%, with a majority of Democrats, Independents and Republicans supporting four of the five components evaluated.
- 75% of Texans support the Bipartisan Safer Communities Act’s enhanced background checks over a period of 10 days that include juvenile records for prospective gun buyers under the age of 21.
- 75% of Texans support the Bipartisan Safer Communities Act’s provision of $300 million in federal money for school safety programs that will fund school resource officers and bolster security in schools.
- 74% of Texans support the Bipartisan Safer Communities Act’s expansion of the current law, which bars people convicted of domestic abuse or subject to a domestic abuse restraining order from owning or purchasing a gun, to include intimate partners.
- 72% support the Bipartisan Safer Communities Act’s establishment of a penalty for people who buy guns for people who don’t qualify to buy a gun.
- 59% support the Bipartisan Safer Communities Act’s provision of $750 million in federal money to states that create “red flag” laws. This component is the only one that does not enjoy bipartisan majority support.
The Demographics of Household Gun Ownership in Texas
- Two out of five Texas adults (42%) live in a household where at least one person is a gunowner, with 52% of white, 35% of Latino and 29% of Black Texans living in such households.
- 50% of the members of the Silent/Boomers cohort live in a household with a gunowner compared to only 33% of Generation Z.
- 57% of Republicans live in a household with a gunowner, in contrast to 36% of Independents and 32% of Democrats.
Read Report Three to learn more about where Texans stand on these proposed reforms, including differences of opinion when considering gender, age, race/ethnicity and partisanship.
Media Release September 22, 2022
Report Four. Texas Trends Survey 2022: School Safety
The survey module includes opinions of 2,140 YouGov respondents 18 years of age and older, resulting in a confidence interval of +/-2.1. The respondents were matched to a sampling frame on gender, age, race/ethnicity, and education and are representative of the Texas adult population.
Highlights
Nine Proposed Policies on School Safety
Respondents were asked what impact they believe the nine different policies would have on school safety. The response options were that the policy would make schools more safe, would make schools less safe, or would not make a difference for school safety.
Figure 1 displays the proportion of Texans who believe each policy would make schools more safe, less safe, and would not make a difference for school safety.
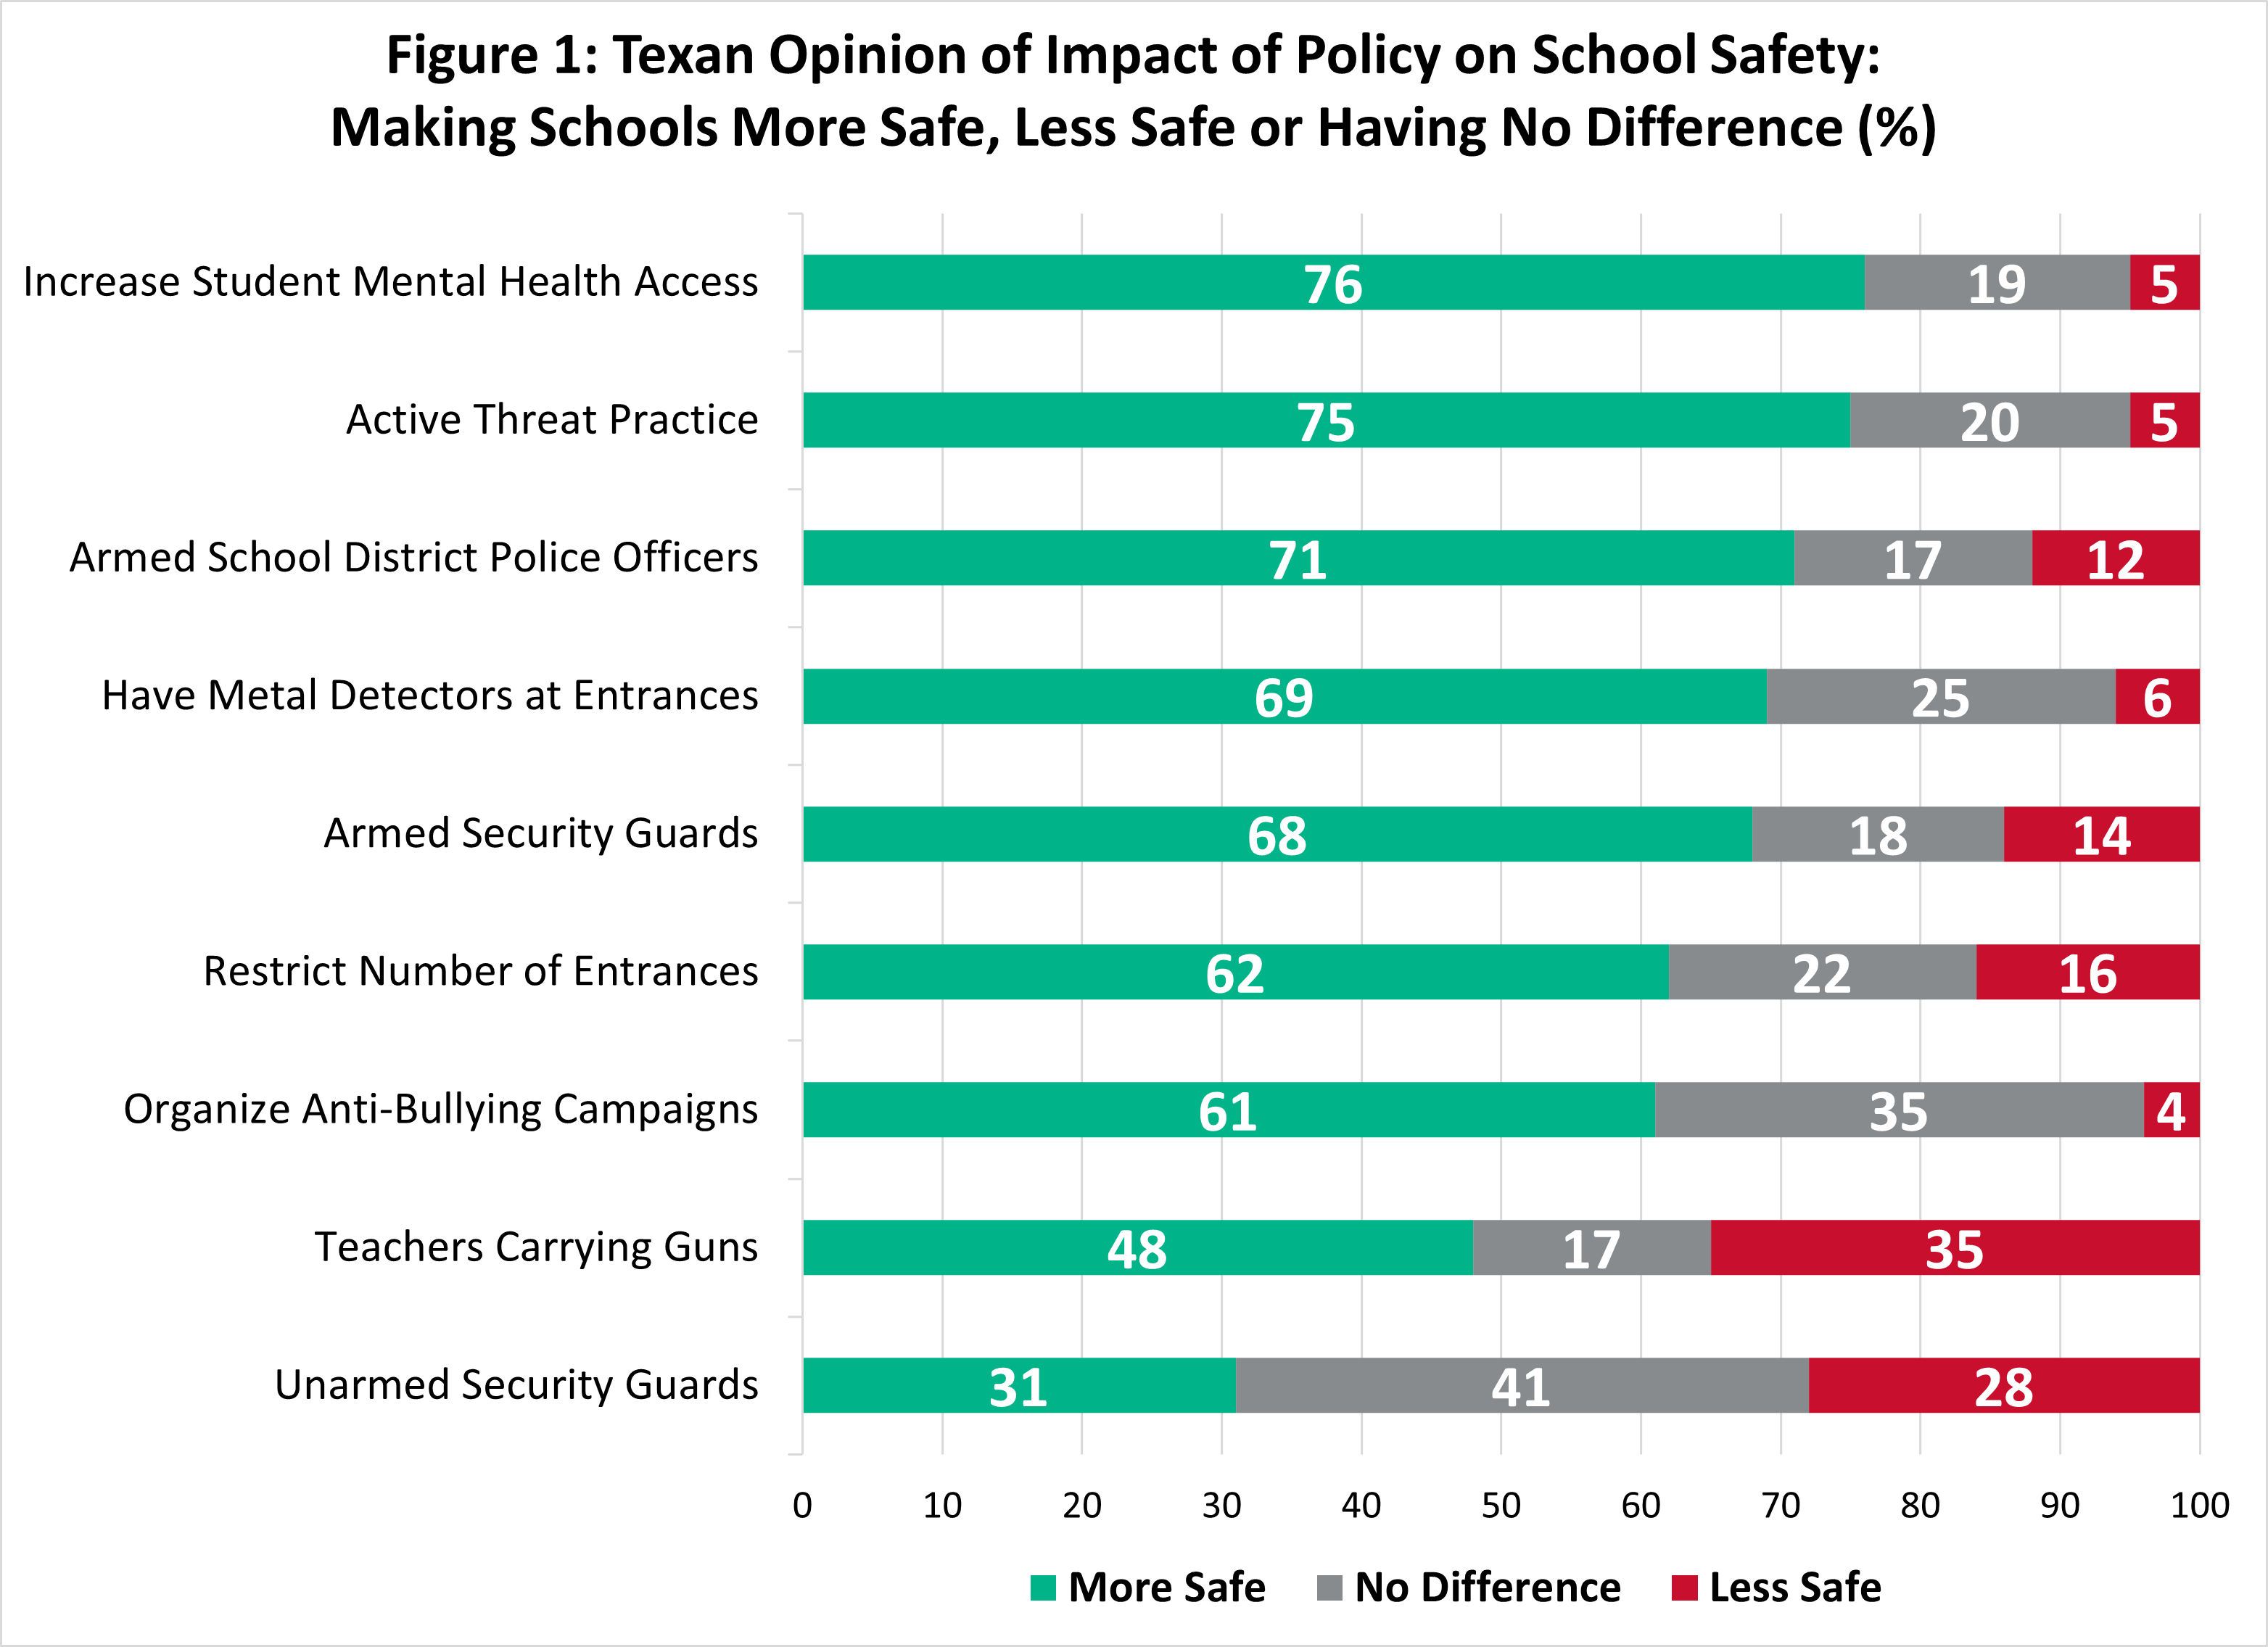
- Three-quarters or more of Texans believe two policies would make schools more safe: increasing student access to mental health services (76%) and practicing lockdowns or procedures for active threat situations (75%).
- An additional two-thirds or more of Texans believe three other policies would make schools more safe: having armed police officers inside school buildings (71%), having metal detectors at school entrances (69%), and having armed security guards inside school buildings (68%).
- An additional three-fifths or more of Texans believe two other policies would make schools more safe: restricting the number of entrances to school buildings (62%) and organizing campaigns to discourage bullying (61%).
- Only two policies are seen by less than half of Texans as not making schools safer: having teachers carry guns in school after undergoing training (48%) and having unarmed security guards inside school buildings (31%).
- Two policies are seen by between a quarter and one-third of Texans as making schools less safe: having teachers carry guns in school after undergoing training (35%) and having unarmed security guards inside school buildings (28%).
- One-third or more of Texans believe two of the policies would not make a difference for school safety: having unarmed security guards inside school buildings (41%) and organizing campaigns to discourage bullying (35%).
- The data underscore that Texans believe that most of these reforms would make a positive difference for school safety, with significant doubts only existing for the policies that would have trained teachers carry guns in schools and would have unarmed security guards inside school buildings.
Read Report Four to learn more about where Texans stand on these proposed school safety policies.
News Release, October 3, 2022
Report Five. Texas Trends Survey 2022: Inflation Expectations
From June 2021 to June 2022, the Consumer Price Index (CPI) for All Urban Consumers increased by 9.1% – the most significant 12-month increase since 1981. An increase in the general price level typically leads to the decline of purchase power across groups depending on several economic factors. This report analyzes the inflation expectations of Texans in the second half of 2022. The report further explores differences in inflation expectations among Texans by income, party identification and voting preferences.
Highlights
- On average, Texans expect a level of inflation of 8.6% for the next twelve months. However, they expect higher inflation in the energy and food sectors (Figure 1).
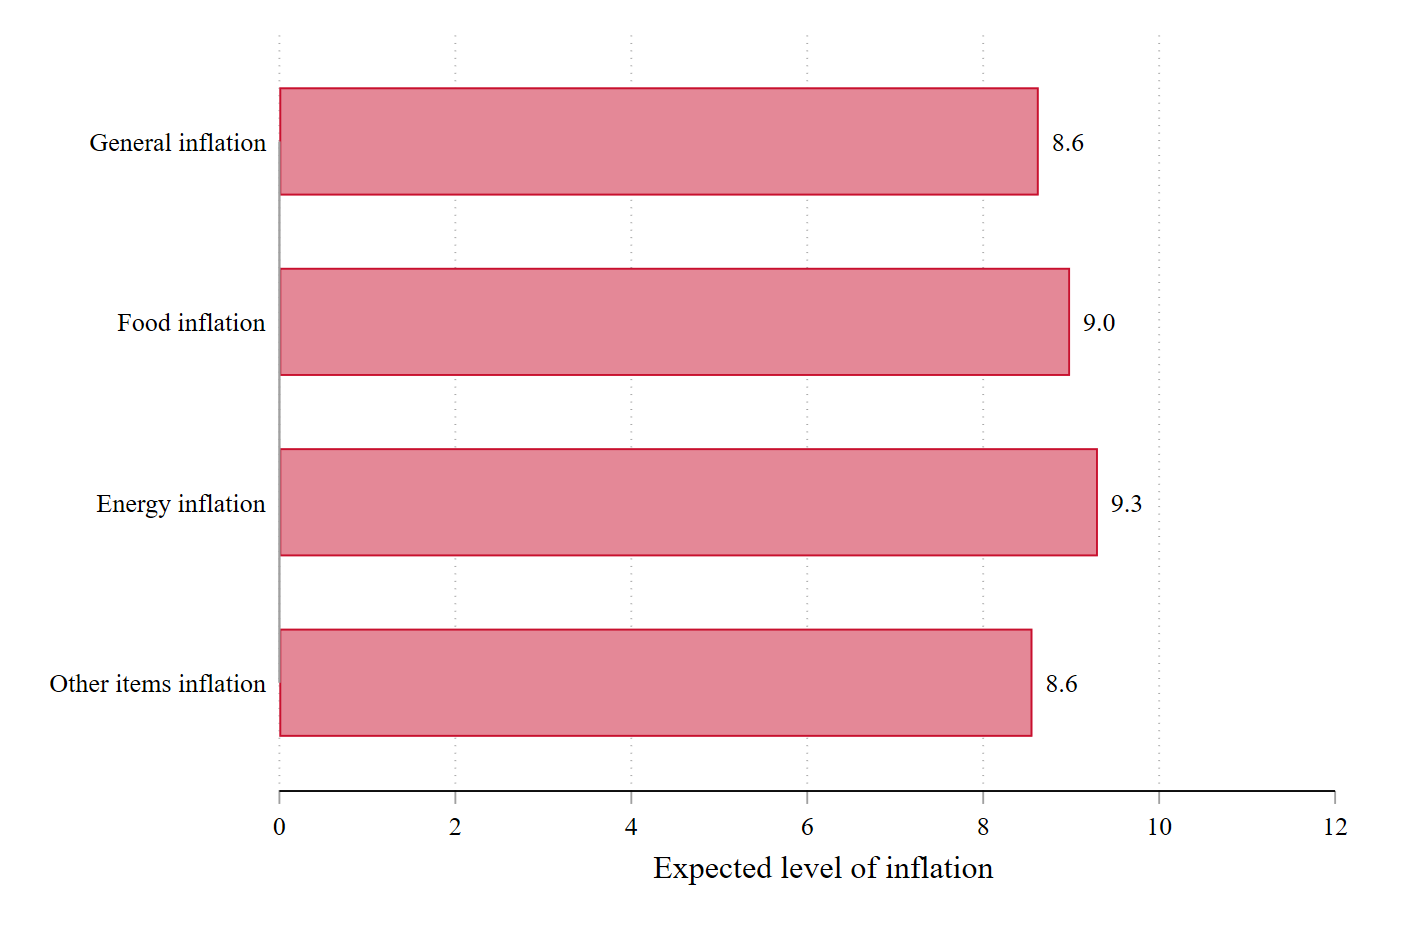
Figure 1: Inflation expectation
- 6% of Texans think that the inflation rate will increase in the next 5 to 10 years.
- Only 22.8% of respondents think inflation will decrease during the same period.
- Only 12.9% of Texans think their income will grow faster than inflation in the following year. This result implies that most Texans expect that their real income (in terms of purchasing power) will shrink in the following year (Figure 2).
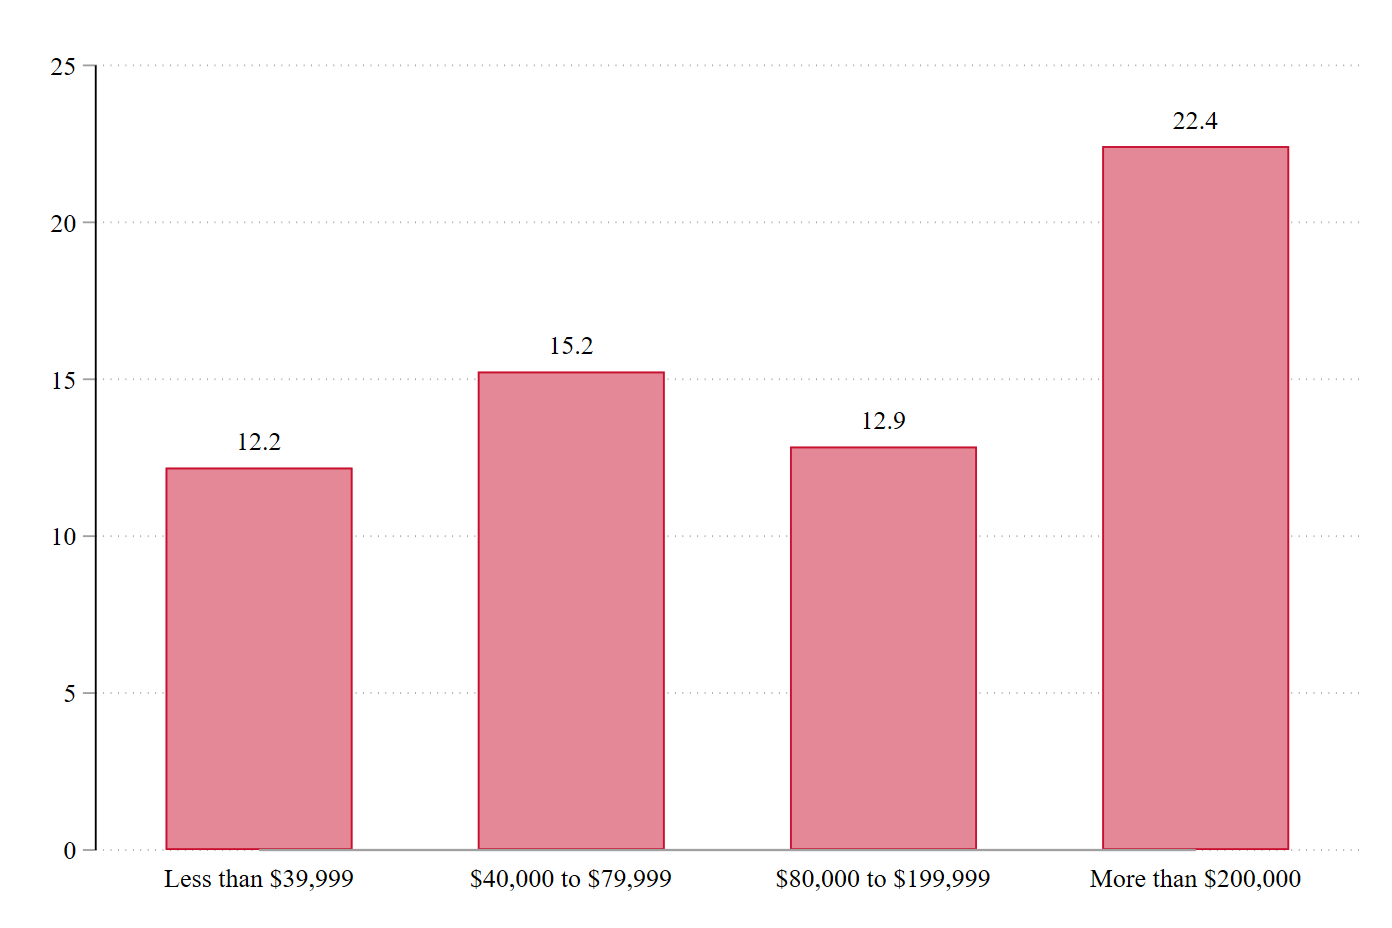
- Lower-income households have higher inflation expectations than higher-income households, likely influenced by the recent evolution of food and energy prices.
- Respondents who favor Gov. Greg Abbott (incumbent) for the governor position expect a higher level of inflation in the next 12 months, whereas respondents who favor Beto O'Rourke (Democratic party candidate) are much more optimistic about the future inflation (Figure 3).
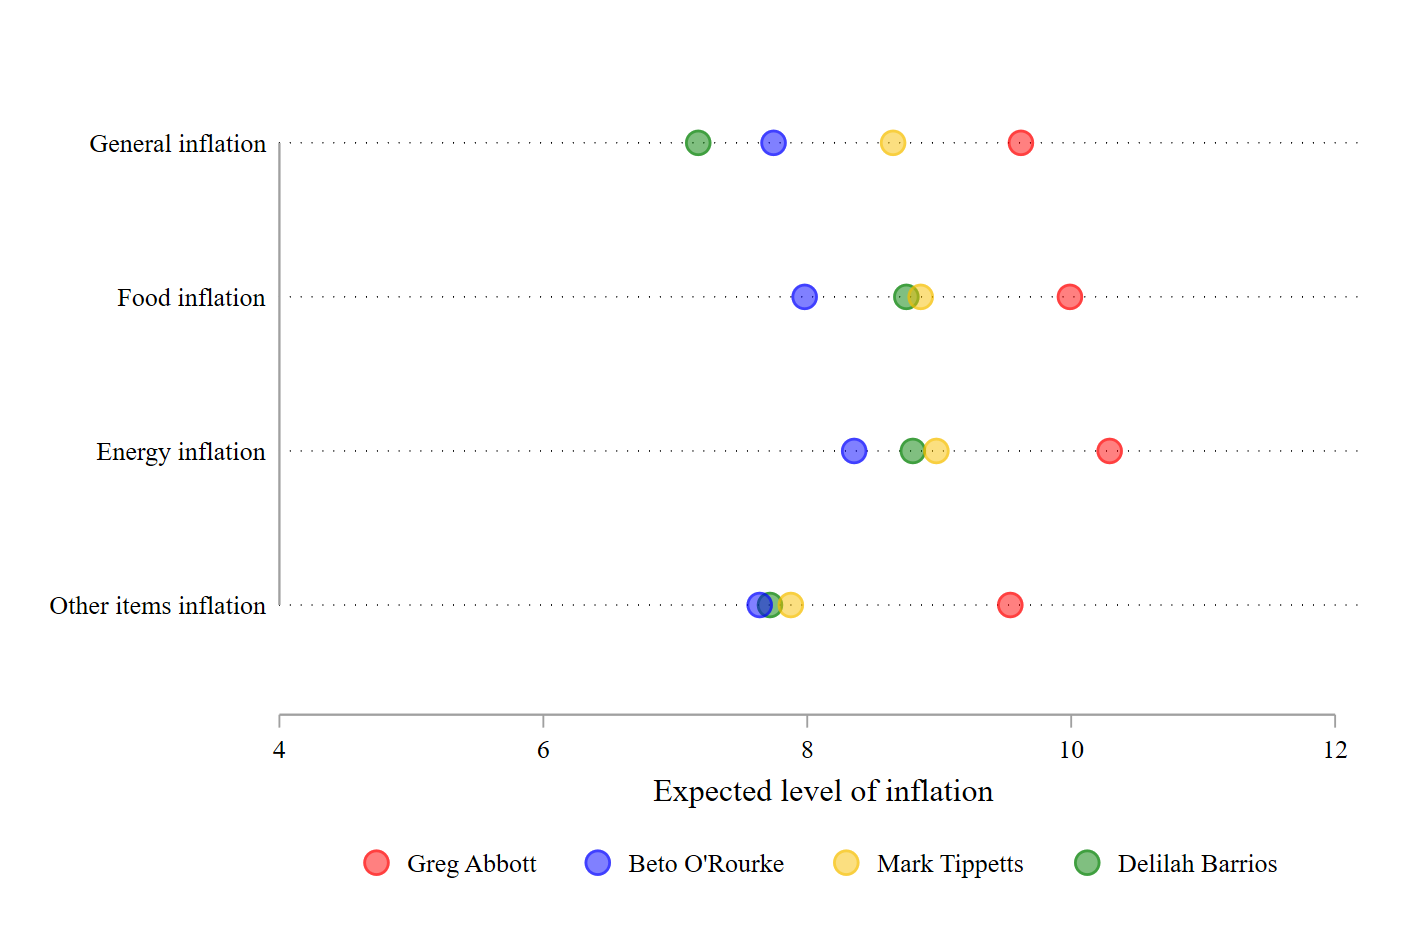
Figure 3: Inflation expectation by voting preference
Read Report Five to learn more about the inflation expectations of Texans.
Media Release, October 6, 2022
Report Six. Texas Trends Survey 2022: Criminal Justice and Immigration
In this report, researchers examined Texans’ attitudes toward criminal justice and immigration issues. The report is organized into two chapters. First, researchers explored opinions on criminal justice issues, including respondents' attitudes on bail reform, trust and effectiveness of law enforcement officers in their communities, and whether increasing funding to law enforcement agencies would impact crime levels. Then, researchers assessed respondents’ opinions on immigration, including reforming the court system, how the US government handles asylum seekers and topics related to legal immigration.
The survey was conducted between Aug. 11 and Aug. 29, 2022, in English and Spanish and included 2,140 registered voters in Texas aged 18 years and older. The margin of error was ±2.1% at the 95% confidence level. Political ideology, race and ethnicity emerged as important factors that explain variations in attitudes toward criminal justice and immigration issues.
Highlights
Criminal Justice
Support for Senate Bill 6
- 57.8% of Texans support Senate Bill 6, also known as the Damon Allen Act, which requires those with prior violent crime records to post cash bail to be released and for prior criminal histories to be reviewed before setting bail.
Trust in local law enforcement by race and ethnicity
- Whites had the most trust in their local law enforcement officers (68.2%), while Black respondents had the least amount of trust in their local law enforcement officers (46.7%).
- Almost half (50.5%) of Hispanic respondents trusted law enforcement in their communities, while about one-fifth of Hispanic respondents did not (21.3%).
Increasing funding for law enforcement officers would help to reduce crime in my community.
- 52.9% of Texans agree that one way to help reduce crime in their communities is to fund law enforcement officers, while 20.2% do not think funding them would aid in crime reduction.
Immigration
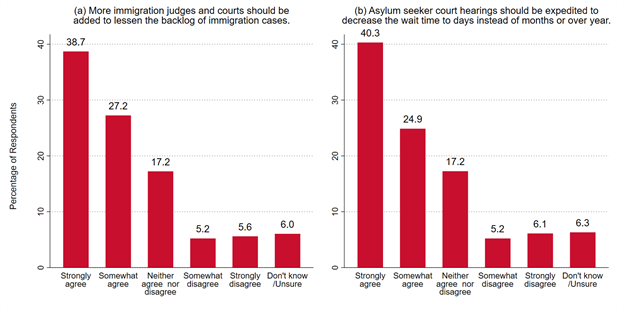
How much do you agree or disagree with statements related to immigration reform?
- 65.9% of Texans in our survey agree that we need to have more immigration judges and courts to help ease the backlog of current and future immigration cases.
- Similarly, 65.2% of Texans agree that court hearings for asylum seekers should be expedited to significantly decrease the wait time for a hearing.
How much do you agree or disagree with statements related to immigration reform?
- Over 80% of conservative or very conservative respondents strongly or somewhat agreed that asylum seekers who did not receive asylum must immediately return to their country of origin.
- At least three-fifths of liberal respondents disagreed with federal border patrol officers expelling immigrants crossing the border regardless of whether they were seeking asylum.
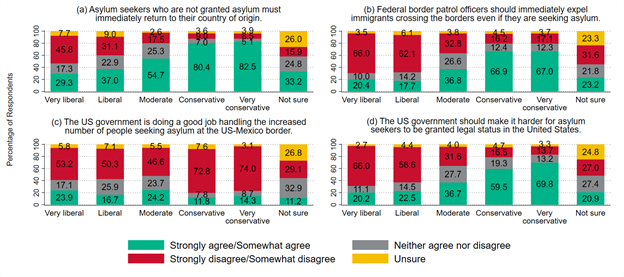
- 59.5% of conservatives and 69.8% of those who said they were very conservative believe the US government should make it harder for asylum seekers to be granted legal status in the US; the inverse was true for those who said they were very liberal (20.2%) or liberal (22.5%).
- There is a higher degree of consensus across all ideological groups regarding handling the increased number of asylum seekers at the US-Mexico border. Almost a majority of each ideological group did not think the US was doing a good job, with those who were very conservative having the highest dissent (74%).
Read Report Six to learn about Texans’ opinions on criminal justice and immigration policy issues.
Media Release, October 13, 2022
Report Seven: Texas Trends Survey 2022: Health Care
Findings from the survey's questions on health care are summarized in this report. This report analyzes health insurance coverage, access to healthcare providers, and respondent's opinions and attitudes on policies related to Medicaid and prescription drug prices.
Highlights
In terms of insurance coverage, 21% of the respondents are not insured. Of those insured:
- The top three types of insurance are: health insurance through their employer or union (29%), Medicare (23%), and Medicaid (13%)
- Whites are more likely to be uninsured (11%) compared to Black (7%) and Hispanic (6%) respondents
- Income is related to access to insurance and insurance type. The highest-income respondents have the lowest uninsured rate (3%), while all other income groups (earning less than $200,00) have a higher uninsured rate (around 8%)
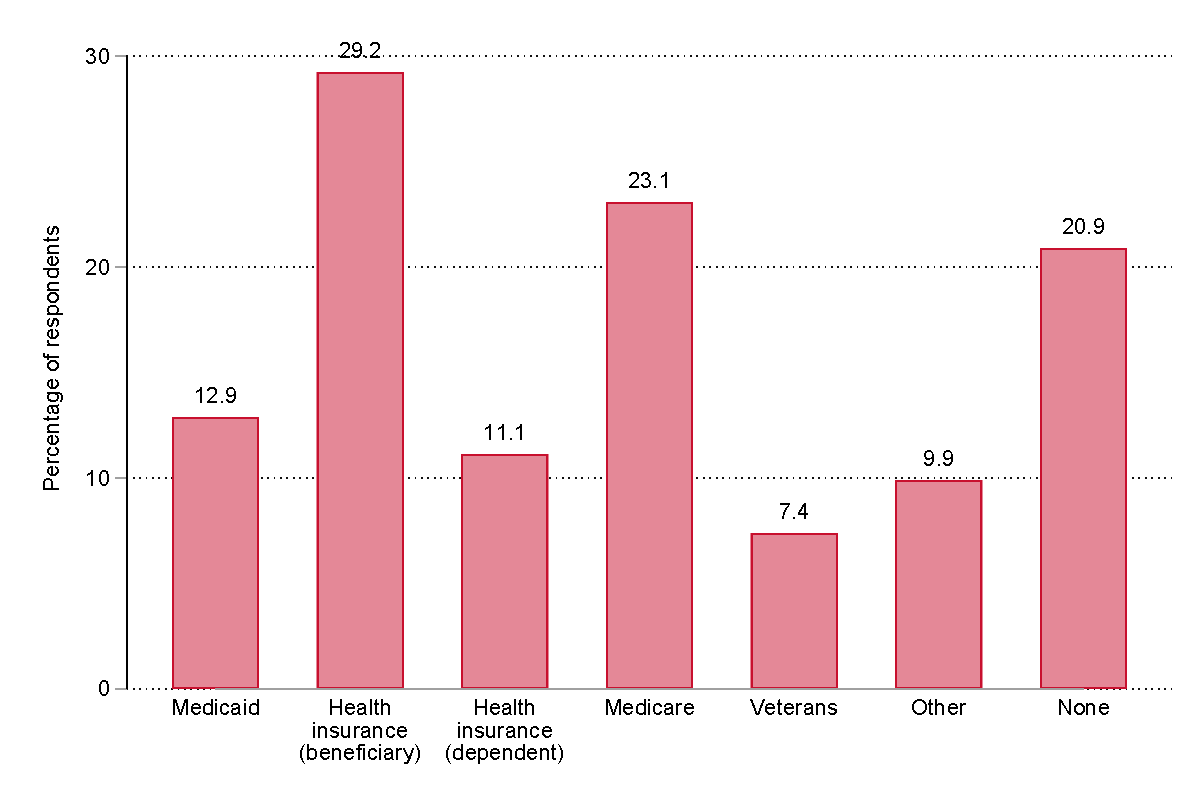
Figure 2.1 Above is a list of different types of health insurance coverage. Please indicate if you are currently covered by any of the following types of insurance. Please select all that apply.
When asked about access to a primary health provider:
- Nearly one fourth of respondents (23%) do not have a regular place to go for health care. Not having health problems (51%) and the cost of co-pays and prescriptions (18%) are the main reasons for not having a regular place to go
- Income level is related with going to a regular place for health care
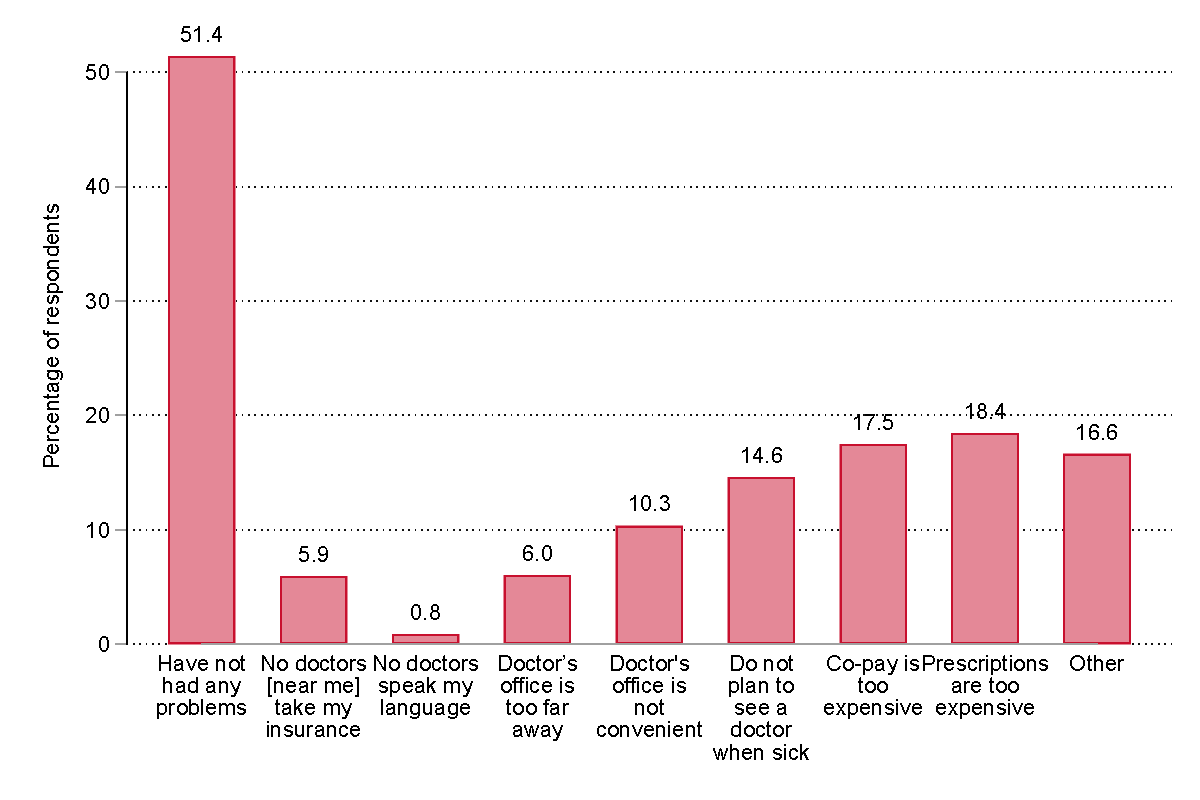
Figure 3.1 What is the main reason you do not have a regular place that you go for health care? Please select all that apply.
Regarding positions on policies about Medicaid and proposals to lower the costs of prescription drugs:
- 83% of respondents supported making it easier for generic drugs to come to market, which was the most supported policy. The least favored proposal was allowing the federal government to set limits on drug prices, though nearly seven in ten (69%) still favored set limits on price increases
- Over half (52%) of the survey respondents were in favor of expanding Medicaid, 30% in favor of keeping Medicaid as it is today, and 18% did not know or were unsure
- Women, democrats, and older respondents were most likely to the proposed policies to lower the costs of prescription drugs
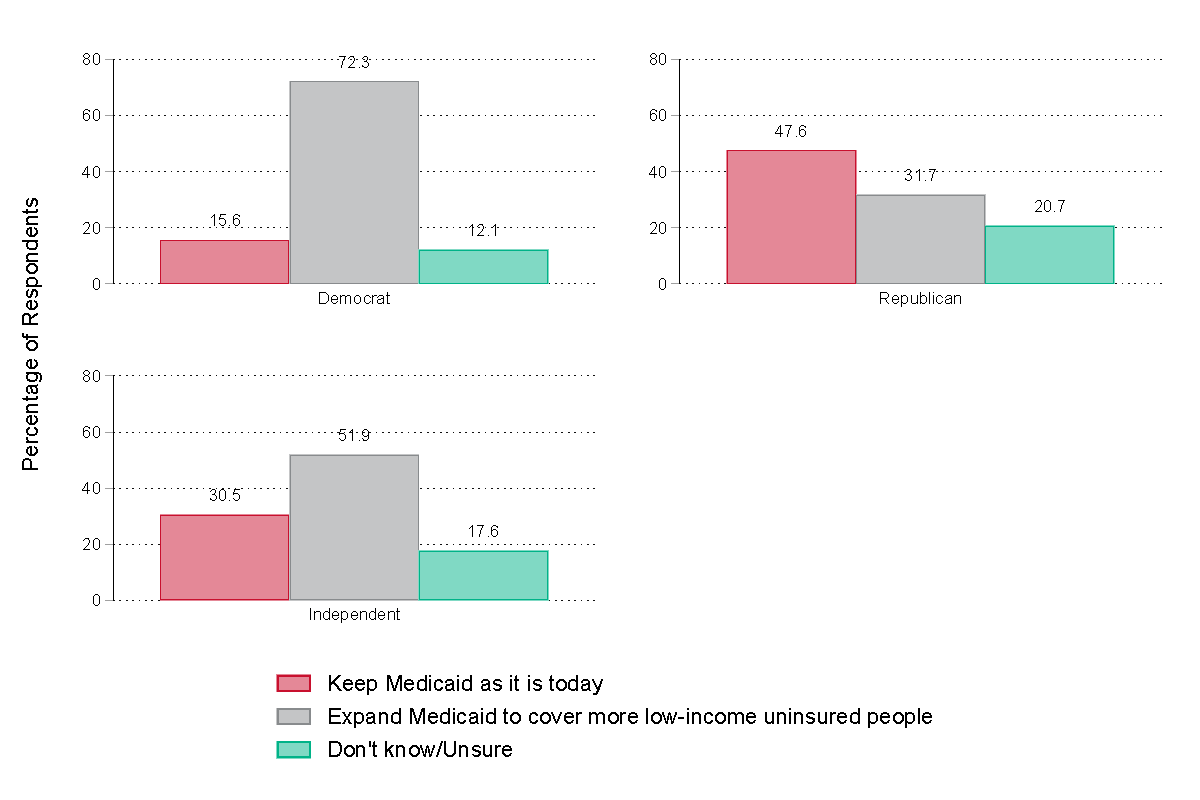
Figure 4.5 Position on Medicaid expansion by political party identification
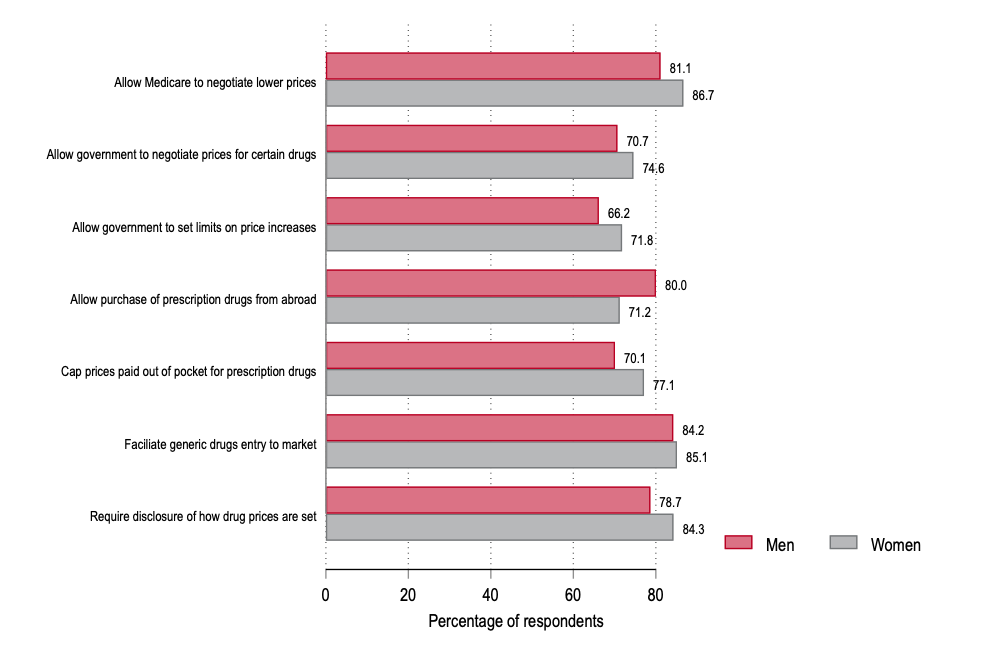
Figure 4.6. Position on proposals to lower the costs of prescription drugs by gender
Read Report Seven to learn about Texans’ opinions on health care and policies related to health care.
Media Release, October 20, 2022