2021: UH-TSU Texas Trends Survey
Report One. Texas Trends Survey 2021: Abortion and Transgender Athlete Policies
The inaugural Texas Trends Survey conducted by the Hobby School of Public Affairs and the Executive Master of Public Administration Program in the Barbara Jordan-Mickey Leland School of Public Affairs at Texas Southern University focuses on opinions about recently passed legislation during the 2021 regular and special sessions of the Texas Legislature and other timely issues important to the Lone Star State. The results of this survey will be presented in four separate reports: abortion and transgender athlete policies, redistricting and election reforms, electric vehicles and criminal justice issues.
The first report of the 2021 Texas Trends Survey examines Texans’ attitudes and preferences related to public policies governing abortion and the requirement that public school students compete only in UIL sports associated with their biological sex.
The survey was fielded Oct. 4-21, 2021 in English and Spanish, with 2,067 YouGov respondents 18 years of age and older, resulting in a confidence interval of +/-2.2. The respondents were matched to a sampling frame on gender, age, ethnicity/race, and education and are representative of the Texas adult population.
Summary
Senate Bill 8 (SB 8), the 2021 Texas abortion law, provides no exceptions for either rape or incest, and only permits abortion after six weeks if the mother’s life is at risk. More than two-thirds (69%) of Texans hold the position that the current Texas abortion legislation is too restrictive, with almost half (46%) believing abortion should be legal in most or all cases after six weeks, and close to one-fourth (23%) thinking that abortion should be allowed after six weeks only in the event of rape or incest or risk to the mother’s life.
However, when Texans were asked how much they support or oppose the legislation (SB 8) banning abortion after a “fetal heartbeat” could be detectable (around six weeks of pregnancy) except to save the mother’s life: 37% of Texans strongly support the legislation, 18% somewhat support it, 11% somewhat oppose it, and 34% strongly oppose it. In sum, among those Texans with an opinion, a narrow majority of 55% supports the legislation while 45% opposes it. This legislation is supported by three-fourths of those Texans whose preferred abortion policy at six weeks is to allow abortion only in the case of rape or incest, exceptions absent from SB 8, in addition to if the mother’s life is at risk.
In regard to the restrictions contained in the Mississippi law prohibiting abortion after 15 weeks, except in the event the mother’s life is at risk or there is severe fetal abnormality, 30% believe abortion should be legal in all or most cases and 31% believe abortion should always be illegal. Two-fifths believe abortion should only be legal in the case of rape, incest or if the mother’s life is at risk (23%) or only if the mother’s life is at risk (16%).
Since 2013, Texas has prohibited abortion after 20 weeks except when the mother’s life is at risk. This legislation is not seen as too restrictive by a majority (57%) of Texans. Almost two in five (37%) believe abortion should be illegal in all cases after 20 weeks while another 20% believe abortion should only be legal if the mother’s life is a risk. One-fifth (22%) support abortion after 20 weeks only in the case of rape, incest or if the mother’s life is at risk while 21% support allowing abortion after 20 weeks in all or most cases.
Black (61%, 42%) Texans are significantly more likely than white (44%, 30%) and Latino (45%, 27%) Texans to believe abortion should be legal in most or all cases after six and 15 weeks, respectively.
Support among Democrats for abortion being legal in most or all cases after six, 15 and 20 weeks is 67%, 51% and 35%, respectively, compared to only 27%, 10% and 7% among Republicans. In contrast, 34%, 45% and 53% of Republicans hold the position that abortion should always be illegal at six, 15 and 20 weeks, respectively, compared to only 10%, 18% and 21% of Democrats.
Approximately two-thirds support allowing an abortion when the baby’s hope of surviving for a long time after birth is near zero (67%) and when the baby would be born with a life threatening disease (65%). If the baby would be born with a serious disability, 58% of Texans favor allowing an abortion to take place.
The respondents were asked about their level of support for House Bill 25 (HB 25) from the third 2021 special session requiring Texas public high school and middle school students to compete only in sports associated with their biological sex, such that a transgender female would not be eligible to compete in athletics with biological females. More than one-half (55%) of Texans strongly support HB 25, along with 15% who somewhat support it for a total proportion of support of 70%. Only 17% of Texans strongly oppose the legislation while 13% somewhat oppose it.
Three-fourths (75%) of whites, 64% of Latinos, and 63% of Blacks support HB 25.
More than nine out of every ten (91%) Republicans support HB 25 compared to 73% of Independents and 48% of Democrats.
Read Report One to learn more about where Texans stand on the laws governing abortion and transgender athletes.
Media Release October 27, 2021
Report Two. Texas Trends Survey 2021: Election Reform and Redistricting
The 2021 Texas Trends Survey’s second report examines Texans’ attitudes and preferences related to election reforms passed during the second special session of the 2021 Texas Legislature and redistricting.
Highlights
- The change in the minimum number of early voting hours from eight to nine hours is supported by 86% of Texans opposed by only 14%.
- The change making ballot harvesting a third degree felony is supported by 82% of Texans and opposed by only 18%.
- The change requiring Texans to provide their drivers’ license number (or last four numbers of their Social Security number) on both their mail ballot application and their mail ballot is supported by 74% and opposed by 26%.
- The modification explicitly restricting assistance to disabled Texas voters of only reading and marking the ballot by those assisting them is supported by 69% and opposed by 31%.
- The change allowing Texas voters to correct mail ballot errors online to prevent their ballot from being rejected is supported by 66% and opposed by 34%.
- The change allowing partisan poll watchers to have more freedom of movement throughout the polling place is supported by 63% and opposed by 37%.
- The prohibition of drive-thru voting is supported by 59% and opposed by 41%.
- Making it a felony for an election administrator to send a mail ballot application to anyone who has not solicited one is supported by 59% and opposed by 41%.
- The change of prohibiting 24-hour early voting by requiring polls to open no earlier than 6AM and close no later than 10PM is supported by 58% and opposed by 42%.
- While 69% of whites support making it a felony for an election administrator to mail out unsolicited mail ballot applications, this change is backed by only 39% of African Americans and by 52% of Latinos.
- 66% of white Texans support the ban on drive-thru voting compared to 55% of Latinos and 42% of Blacks.
- Noteworthy generational differences exist in regard to support for the ban on drive-thru voting, which is supported by more than two-thirds (69%) of the Silent/Baby Boomer generations, but by only 51% of Millennials and 52% of Generation Z, with Generation X halfway between the two extremes at 60%.
- The proportion of Republican support for the three reforms ranges from 79% (prohibit 24-hour voting) to 85% (prohibit drive-thru voting), more than double the proportion of Democratic support for these two reforms of 32% and 33%.
- When asked “How much of a problem is it, when one political party controls the governorship and both chambers of the state legislature, that the legislative districts are drawn to intentionally favor that majority party?”, 48% of Texans believe the scenario described is a major problem, 21% believe it is a minor problem, 12% do not consider it to be a problem, and 19% don’t know enough to have an opinion. Excluding the don’t know responses, 59% of Texans with an opinion believe that this scenario of tailor-made districts designed by, and to benefit, the majority party is a major problem compared to 27% who see it as a minor problem and 14% who don’t consider it to be a problem.
- 76% of Democrats considers one party control over the redistricting process resulting in legislative districts intentionally drawn to favor the majority party to be a major problem, with only 6% considering it not to be a problem. A majority of Independents (57%) also considers the scenario to be a major problem, with 19% of Independents not seeing it as a problem at all. A plurality of 45% of Republicans considers this situation to be a major problem, followed by 35% who view it as a minor problem and 20% who don’t consider it to be a problem.
Read Report Two to learn more about where Texans stand on election laws and redistricting.
Media Release October 29, 2021
Report Three. Texas Trends Survey 2021: Criminal Justice Reforms
This report examines Texans’ attitudes related to criminal justice and proposed criminal justice reforms in the Lone Star State.
Highlights
The survey respondents were asked how much they support or oppose the implementation of nine proposed criminal justice policies in Texas:
-
- Cut police department budgets.
- Require police officers to receive more extensive conflict de-escalation training.
- End Stop-and-Frisk policing, where officers have wide discretion to stop people and search them for weapons.
- Use some of the police department’s budget to fund social services.
- Allow first-time offenders charged with a non-violent crime to be released without paying bail while they await trial.
- Legalize the sale and use of recreational marijuana.
- Legalize the sale and use of recreational meth, cocaine, heroin and opioids.
- Prosecute police officers who use excessive force.
- Require police officers to receive more extensive racial bias training.
- The most popular proposed policy would require police officers to receive more extensive conflict de-escalation training, which is supported by 86% of Texans, and is followed closely in support (79%) by a policy that would require the prosecution of police officers who use excessive force.
- Two additional reforms also enjoy robust support. One would require police officers to receive more extensive racial bias training, a policy that is supported by 74% of Texans, while another (67%) would legalize the sale and use of recreational marijuana.
- Two proposed reforms are opposed by a majority of Texans. Three-quarters (75%) of the respondents oppose cutting the police budget, and 52% oppose using part of the police department’s budget for funding social services.
- A higher proportion of Black Texans than white and Latino Texans supports every one of the nine reforms.
- In the case of four reforms, Black support is substantially greater than both white and Latino support, with the levels among the latter two not significantly different. Most noteworthy is the support of more than one-half of Blacks (51%) for cutting police department budgets compared to less than one-quarter of Latinos (23%) and whites (20%).
The respondents were asked the extent to which they agreed with four “pro-police” statements:
-
-
-
-
- The budget for the police in my community should be increased.
- Because police officers have such dangerous jobs, we should not second-guess the decisions they make.
- I trust the police in my community.
- People today do not give our police officers the respect they deserve.
- More than two-thirds of the respondents agree that they trust the police in their community and that people today do not give police officers the respect they deserve while more than three-fifths also agree that the budget for the police in their community should be increased. In contrast, three-fifths of Texans do not agree that because police officers have such dangerous jobs, we should not second-guess the decisions they make.
- Several of the racial/ethnic differences in “pro-police” support are substantial. For instance, 78% of whites and 68% of Latinos trust the police in their community compared to only 50% of Blacks. And while 77% of whites and 69% of Latinos agree that people don’t give police the respect they deserve, only 47% of African Americans concur. Finally, while 69% of whites and 63% of Latinos agree that the budget for the police in their community should be increased, only 48% of Blacks concur.
-
-
-
The respondents were asked what impact three bail reform policies would have on the amount of crime in their community.
-
-
-
-
- More than four-fifths (82%) believe that a policy that prevents suspects with previous convictions for violent crimes from being released on bail would reduce crime.
- Three-quarters (75%) of Texans believe that a policy that would prevent suspects who have been arrested while currently out on bail to again be released on bail would reduce crime.
- More than three-quarters of white, Latino and Black Texans believe that preventing suspects who have prior convictions for violent crimes from being released on bail will reduce crime.
- More than two-thirds of all three groups believe that preventing suspects who are arrested while out on bail from being released on bail again will reduce crime.
- Slightly more than half of Texans agree that Blacks and Latinos receive less equal treatment than whites in the Texas criminal justice system.
- One half of Texans agree that the police in Texas treat Blacks and Latinos less favorably than whites.
- More than half (54%) of Texans agree that Texas police officers are more likely to use force when confronting Black suspects than when confronting white suspects, and one half (50%) also believe this to be true when confronting Latino suspects rather than white suspects.
-
-
-
Read Report Three to learn more about where Texans stand on criminal justice reforms.
Media Release November 11, 2021
Report Four. Texas Trends Survey 2021: Electric Vehicle
This is the fourth report from the first survey. This report examines Texans’ political attitudes related to electric vehicles, obstacles to electric vehicle adoption, and support for public policies that would promote the purchase and lease of electric vehicles. The survey, fielded between Oct. 4 and Oct. 21, 2021, asked 2,067 respondents about whether they owned or planned to own an electric vehicle, the reasons why they would not consider owning or leasing an electric vehicle in the future, and support for three policy options aimed at encouraging the purchase or lease of electric vehicles.
Highlights
- Over 90% of respondents did not currently own or lease a vehicle that only uses electric power.
- Of those who did not currently own or lease an electric vehicle, only 11% said they were very likely to own or lease an electric vehicle compared to 38% who said they were not at all likely.
- The main reasons why respondents agreed they would not consider buying or leasing an electric vehicle were the cost of electric vehicles (57% of respondents) and the lack of an adequate amount of charging stations (53% of the respondents).
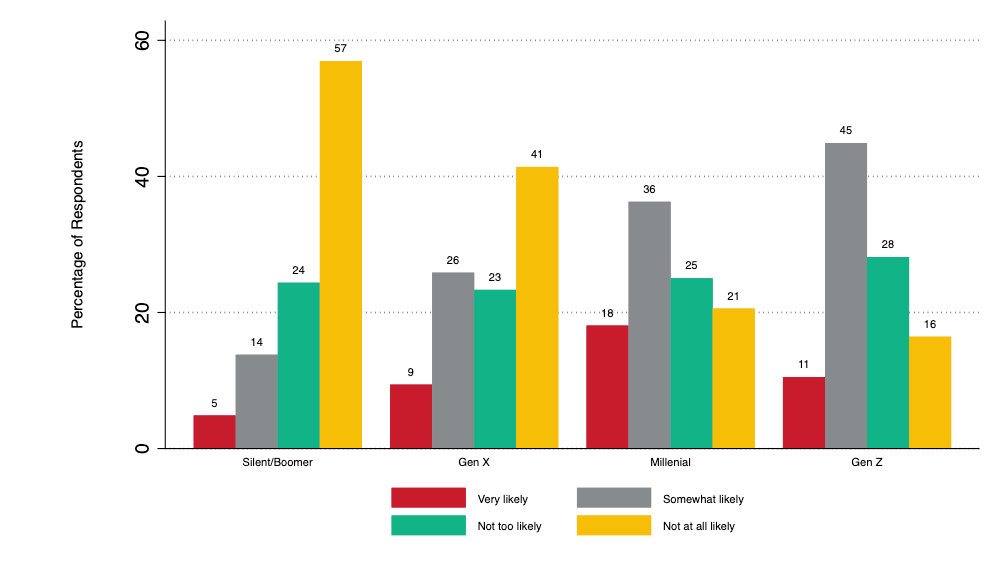
- The younger the generation, the more likely to own or lease an electric vehicle. Among the Silent/Boomer generation surveyed, only 2% reported owning or leasing an electric vehicle compared to 17% of the Gen Z participants.
- Most respondents from the Silent/Boomer generation (57%) said they were not at all likely to purchase or lease and electric vehicle in the future, compared to 17% of Gen Z’ers, 21% of Millennials, and 41% of the GenX’ers.
-
-
-
Figure 2.4 Likelihood of owning or leasing an electric vehicle by generation
-
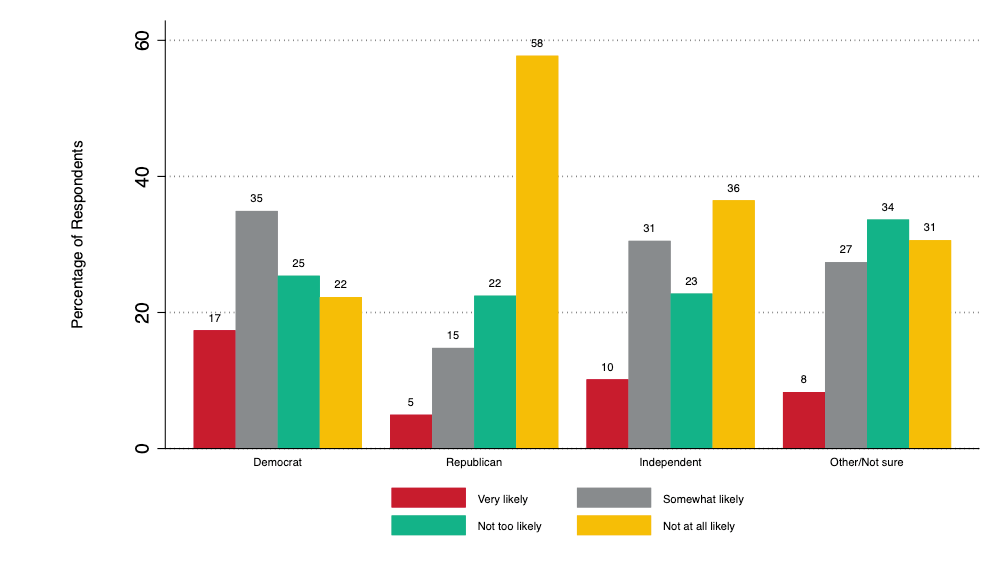
- Respondents who identify with the Republican Party (58%) were more likely to say they
are not at all interested in owning or leasing and electric vehicle compared to Democrats
(22%), Independents (36%), and those who identified with no or another political party
(31%).
-
Figure 2.5 Likelihood of owning or leasing an electric vehicle by party ID
-
-
-
-
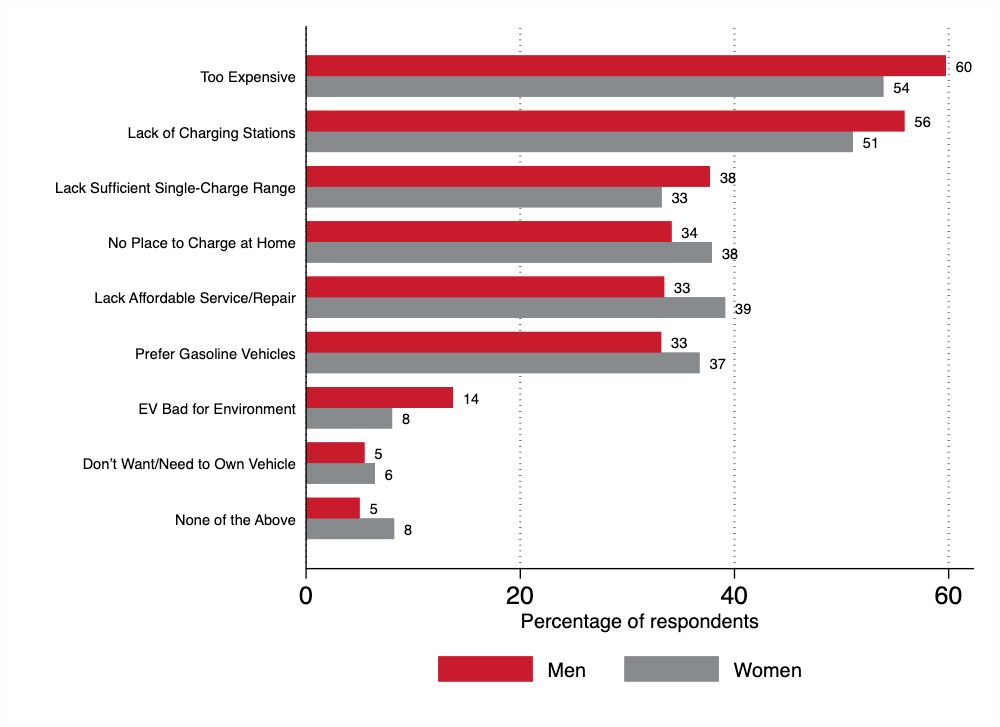
- Sixty percent of men and 54% of women who said they were unlikely to purchase or lease an electric vehicle in the future cited cost as one of the reasons.
-
-
-
-
-
Figure 3.3 Reasons for not wanting to purchase or lease an electric vehicle by gender
-
Respondents were also asked to the extent to which they support three policy options for electric vehicles.
-
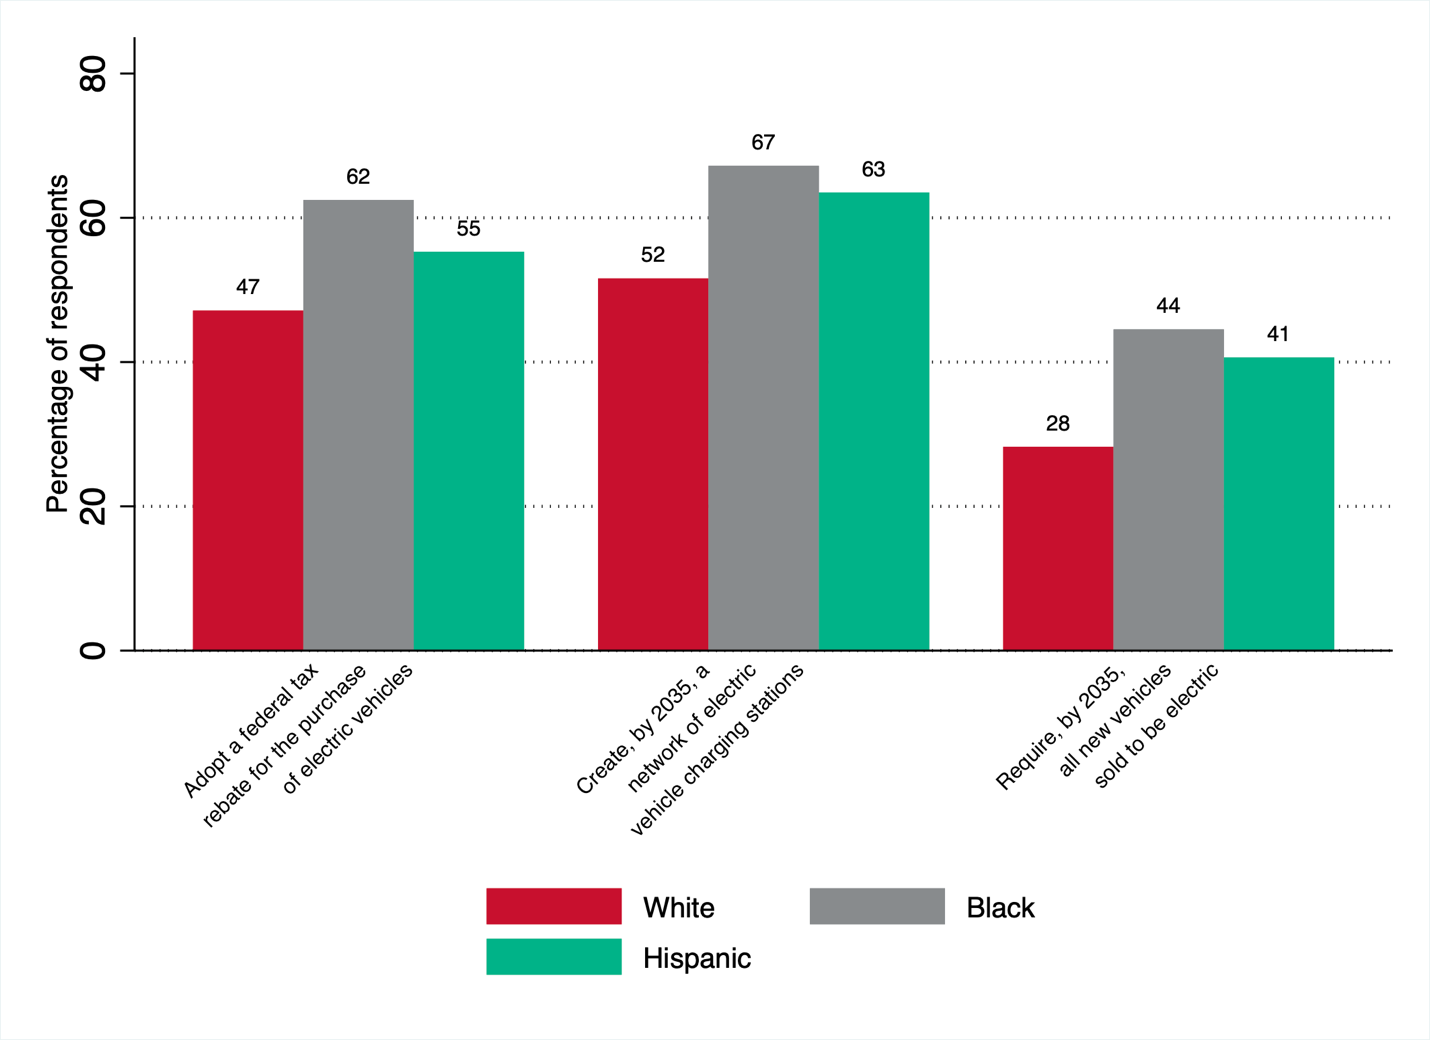
- Nearly three-fourths of respondents strongly or somewhat supported the creation of a network of electric vehicle charging stations across Texas and the US comparable to the network of gas stations by 2035; three-fifths of respondents supported a federal tax rebate for the purchase of electric vehicles.
- Black (67%) and Hispanic (63%) respondents shared more support than white (52%) respondents for creating a network of charging stations across the US and Texas. Men (61%) were more likely than women (57%) to support this policy option.
- Republicans were overall the least likely to support any of three policy options and Democrats were the most likely with a substantial majority supporting either a federal tax rebate (72%) or the creation of a network of charging stations (76%).
-
-
Figure 5.1 Electric vehicle policy support by race and ethnicity
Read Report Four to learn more about where Texans stand on electric vehicles.
Media Release, February 25, 2022