Texas Election 2020
Will Texas turn blue in 2020? What do Texans think about national and state officeholders? What is the voting experience in a pandemic like? Is there a media bias in political coverage? What are the pressing issues facing the Lone Star State? To answer these questions and more, the Hobby School of Public Affairs at the University of Houston conducted an online statewide survey of likely voters in Texas between October 13 and October 20, 2020. With 1,000 YouGov respondents, the survey has a confidence interval of +/-3.1%. The results of this survey will be presented in four separate reports. The first report explores the vote intention in the presidential, U.S. Senate, Railroad Commission, and judicial races as well as favorability ratings, state issues and confirmation of the next U.S. Supreme Court Justice. Opinions about voting during a pandemic and potential voting reforms comprises the second report. The third report delves into beliefs about media bias in political coverage. The final report looks ahead at the issues of most concern before the Texas Legislature convenes in January 2021.
Report One. Vote Intention in the 2020 Election
The Presidential Race
President Donald Trump leads challenger Joe Biden, 50.0% and 44.7% respectively. Other candidates combine for 2.7% and another 2.7% are undecided.
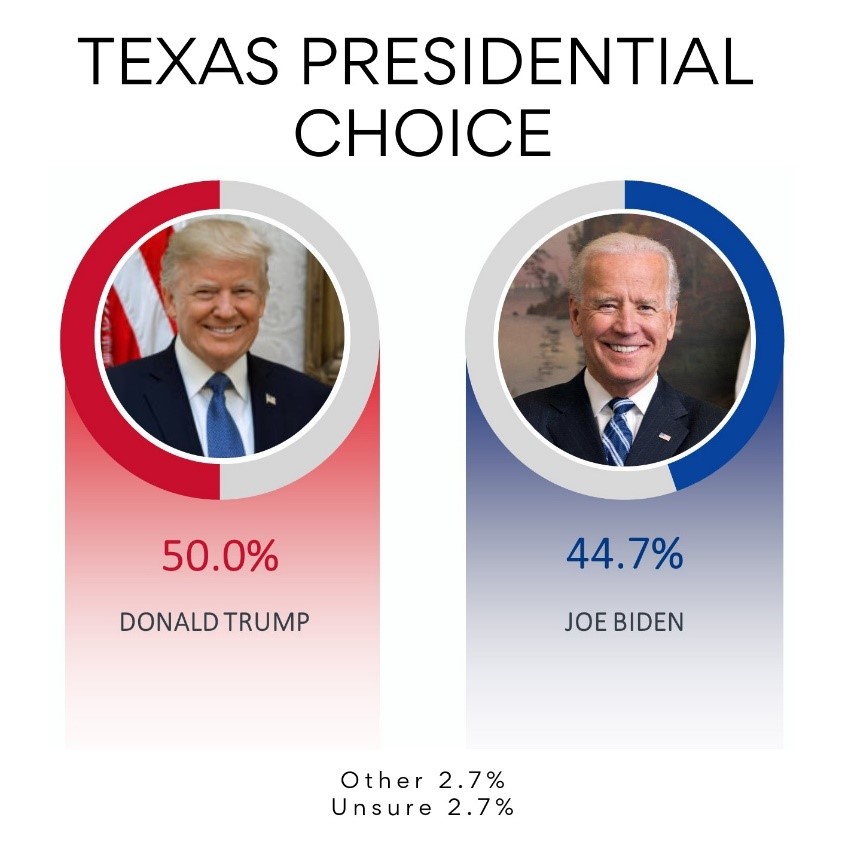
Biden holds a slight edge over Trump among women voters, 49.5% to 46%. Trump is preferred among men by a notably larger margin, 54.3% to 39.5%.
While 63% of Anglos support Trump, and 87% of African-American voters back Biden, the gap is narrower among Latino voters: 56% support Biden, while 38% back Trump.
Other Statewide Races
Incumbent U.S. Sen. John Cornyn leads Democratic challenger MJ Hegar, 48.9% to 41.6%.
Republican Jim Wright leads in the race for an open seat on the Texas Railroad Commission, with 46.8% of the vote; Democrat Chrysta Castañeda has 38.4%.
Republican Nathan Hecht leads Democrat Amy Clark Meachum 47.5% to 40% for Texas Supreme Court chief justice.
Republican Jane Bland leads Democrat Kathy Cheng in the race for Supreme Court Justice Place 6, 49.2% to 40.1%.
In the race for Texas Court of Criminal Appeals Judge Place 3, Republican Bert Richardson (48.2%) leads Democrat Elizabeth Davis Frizell (38.3%) by 9.9%, with 13.5% undecided.
Selecting the U.S. Supreme Court Justice
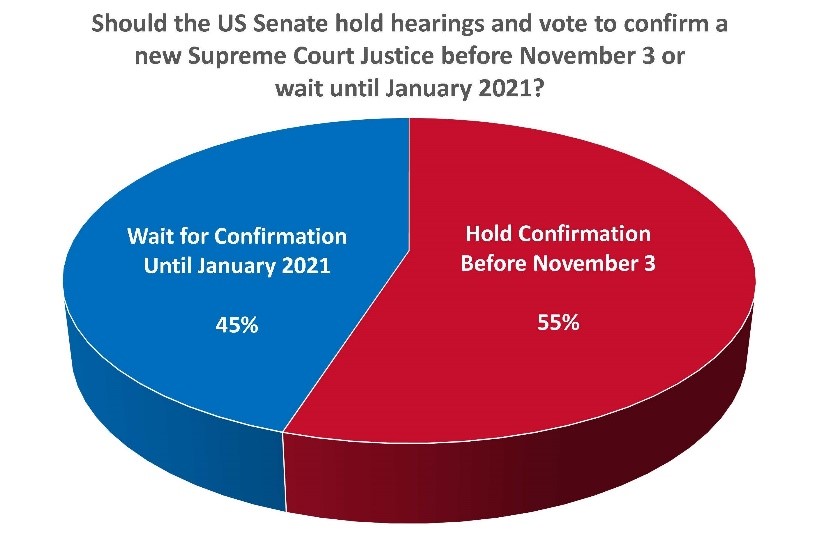
Texans are divided on when to hold hearings and confirm the next U.S. Supreme Court Justice. A majority (55%) of the respondents favor holding the confirmation hearings and vote prior to Election Day while 45% prefer waiting until January 2021 to do so.
Report One: Texas Election 2020: Candidates, Favorability & the U.S. Supreme Court Confirmation
Media Release October 26, 2020
Report Two. Voting in the COVID-19 Era and Election Reforms
Voting In-Person
One third (33.3%) of the 1,000 respondents reported that they had already voted in-person. Overall, experiences were positive in terms of COVID-19 precautions. An overwhelming majority of the respondents agreed that poll workers (97.4%) and voters (94.7%) wore masks at the polling site where they voted early. A high proportion (87.2%) also agreed that six feet social distancing was maintained by voters at their polling location. Three out of five (61.5%) early voters agreed that voters were provided with gloves to avoid having to touch public surfaces with their bare skin.
Regarding the perception of the ability to vote safely, three-fifths (59.5%) of the respondents either strongly agreed (36.0%) or agreed (23.5%) that voting in-person was as safe or safer than going to the grocery store.
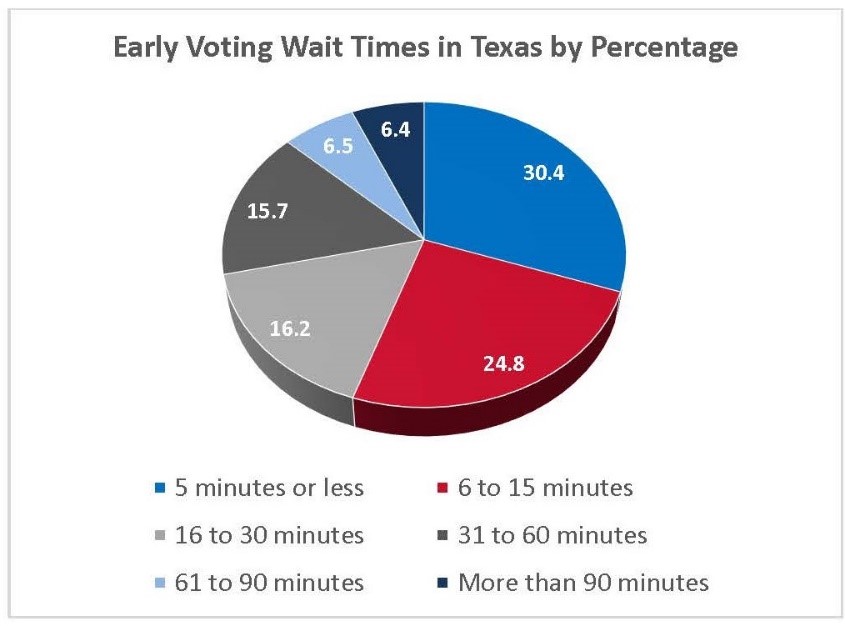
A majority (55.2%) of Texans waited 15 minutes or less to gain access to the ballot. At the other end of the spectrum, 12.9% of the respondents had to wait more than an hour, 6.5% for between 61 and 90 minutes and 6.4% for more than 90 minutes.
Once voters signed in and entered the polling booth, more than three-fourths (77.5%) of the early voters voted in 10 minutes or less.
Opinions about Potential Election Reforms
Looking ahead to future elections, the likely Texas voters were asked about their support for or opposition to five potential election-related reforms:
- Online voter registration for all eligible voters
- Automatic voter registration for all eligible voters
- No-excuse voting by mail for all registered voters
- Mail every registered voter a ballot for general elections
- Non-citizen eligibility to vote in municipal and school district elections
The most popular reform is the adoption of online voter registration, which is strongly supported by almost two-thirds (65.6%) of voters and opposed by one fourth (27.5%) of voters. The only other reform that enjoys the support of a majority (51.8%) of votes is automatic voter registration.
To learn more about voting in the age of COVID-19 plus information about the end of straight-ticket voting and correlations between party identification and age and election reforms, read the full report.
Report Two: Texas Election 2020: Voting in the COVID-19 Era and Election Reforms
Media Release October 28, 2020
Report Three: Texas Election 2020: Information Sources & Perceptions of Media Bias
Information Sources for 2020 Candidates and Elections
The 1,000 likely Texas voters were asked to what extent they relied on eight different sources for information about the 2020 candidates and elections. The choices included newspapers (online or print), radio, network & cable TV news, local TV news, candidate campaign websites, Facebook, Twitter, and YouTube. The most common sources that are relied on the most by likely Texas voters either “A Lot” or “Some”, are network & cable TV news (54.1%) and local TV news (47.9%).
The least common sources, those that the respondents report they do not rely on at all, are Twitter (69.4%), YouTube (59.4%), and Facebook (59.3%). In other words, between three-fifths and two-thirds of likely Texas voters are not relying at all on social media for information on candidates and elections this year. However, when looking at the respondents by generation, Millennials and members of Generation Z are significantly more likely than Baby Boomers and members of the Silent Generation to rely “A Lot” on Twitter (18.0% vs. 3.6%) and YouTube (18.6% vs. 3.1%),
When considering partisanship, there are few differences in reliance on various media outlets with the exception of Republicans being significantly more likely than Democrats to say they rely “Not at All” on newspapers (59.0% vs. 32.6%), local TV news (40.8% vs. 18.9%), and Twitter (80.7% vs. 59.1%).
Perceptions of Media Bias
The respondents were asked if they believed that specific media outlets have a strong liberal bias, a slight liberal bias, a slight conservative bias, a strong conservative bias, or if they believed that the media outlet was neutral and objective. Respondents also had the option of answering that they did not know enough about the outlet to have an opinion. The media outlets included are CNN, Fox News, National Public Radio (NPR), the New York Times, the Texas Tribune, the Wall Street Journal, and their local newspaper.
Highlights
- 40% said the New York Times has a “strong liberal bias,” and an additional 15% said it has a “slight liberal bias.” Only 6% said it has a conservative bias.
- 41% said Fox News has a strong conservative bias, with an additional 23% saying it has a slight conservative bias. 15% said it has a liberal bias.
- National Public Radio (25.8%) is viewed as neutral and objective by the highest proportion of likely Texas voters, followed closely by the local newspapers (24.4%) and the Wall Street Journal (23.2%).
Read the full report to learn more.
Report Three: Texas Election 2020: Information Sources & Perceptions of Media Bias
Media Release November 2, 2020
Report Four: Texas Election 2020: The Most Pressing Policy Issues Affecting the Lone Star State in the Eyes of the 2020 Texas Voters
The Most Critical Issues
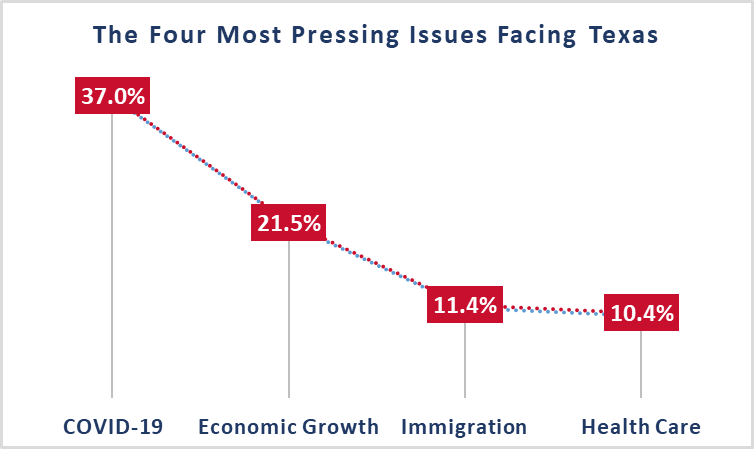
The respondents were asked which of 10 salient current issues they considered to be the most pressing one affecting Texas. The ten options included COVID19, economic growth, immigration, health care, education, economic inequality, climate change, racial Inequality, criminal justice reform, and gun control. COVID19 was considered to be the most pressing issue by 37.0% of the likely voters, followed by economic growth (21.5%), immigration (11.4%) and health care (10.4%) with percentages in the double digits. The remaining issues ranged from 7.1% for education to 1.3% for gun control.
After determining what they considered the most pressing issue facing Texas, the respondents were asked what remaining issues they considered the second and third most important. More than half of the respondents (55.8%) considered COVID-19 to be one of the three most pressing issues affecting Texas, followed by more than two-fifths citing economic growth (45.8%) and health care (41.1%), and slightly more and less than one-third citing immigration (34.0%) and education (32.6%). Racial inequality (18.7%) was listed by almost one-fifth of respondents, with relatively equal shares of respondents listing climate change (14.4%), economic inequality (14.0%), criminal justice reform (13.9%) and gun control (12.0%) as one of the top three issues facing the state.
Highlights
- Almost six out of ten (58.9%) of Democrats listed the pandemic as their top concern compared to 26.7% of Republicans and 27.6% of Independents in agreement.
- Republicans and Independents chose economic growth as the top issue, with 31.6% and 25.7% support respectively, compared with 4.1% of Democrats.
- A majority (57%) of African Americans, 46% of Latinos and 29% of Anglos listed the pandemic as their top priority.
- Anglos (27.8%) were significantly more likely than African Americans (7.0%) to consider economic growth as the most pressing issue.
- Anglos (14.8%) and Latinos (10.7%) were significantly more likely than African Americans (0.3%) to rank immigration as the most pressing issue.
- The Silent Generation and Baby Boomers (16.0%) were significantly more likely than Millennials and Generation Z (5.8%) to identify immigration as the most pressing issue.
- Men (25.4%) were significantly more likely than women (17.9%) to pinpoint economic growth as the most pressing issue.
- Members of the Millennial and Generation Z cohort (26.6%) were significantly more likely than the members of the Silent Generation and Baby Boomer cohort (8.2%) to identify climate change as one of the three most pressing issues.
- Members of the Millennial and Generation Z cohort (20.8%) were significantly more likely than the members of the Silent Generation and Baby Boomer cohort (7.2%) to rank economic inequality as one of the three most pressing issues affecting Texas.
Read the full report to learn more.
Media Release December 1, 2020
Research Team
Kirk P. Watson, Dean, Hobby School of Public Affairs
Renée Cross, Senior Director & Researcher, Hobby School of Public Affairs
Jim Granato, Associate Dean & Professor, Hobby School of Public Affairs
Mark P. Jones, James A. Baker III Institute for Public Policy's Fellow in Political Science, Rice University; Senior Research Fellow, Hobby School of Public Affairs
Yewande Olapade, Post-Doctoral Fellow, Hobby School of Public Affairs
Pablo M. Pinto, Director, Center for Public Policy; Associate Professor, Hobby School of Public Affairs
Savannah Sipole, Research Associate, Hobby School of Public Affairs
Agustín Vallejo, Post-Doctoral Fellow, Hobby School of Public Affairs
Additional Texas Election Reports
Texas Democratic Primary Election 2020 Survey
The Texas Voter ID Law and the 2016 Election: A Study of Harris County and Congressional District 23
The Texas Voter ID Law and the 2014 Election: A Study of Texas’s 23rd Congressional District