Houston Election 2023
With open mayoral and controller seats on the City of Houston ballot in November 2023, much attention is being paid to city politics in the nation’s fourth largest city. Who are the frontrunners for these top positions? What policy issues are most pressing on the minds of the city’s likely voters? To answer these questions and more, the Hobby School of Public Affairs at the University of Houston conducted a survey of Houstonians who are likely to vote in the 2023 mayoral election. The survey was fielded between July 12 and July 20, 2023 in English and Spanish. The representative survey population of 800 has a margin of error of +/- 3.5%.
The results of the survey will be presented in a series of two reports. The first report examines the mayoral and controller races in November, favorability ratings for the mayoral candidates and potential runoff scenarios in the contest for mayor. The second report focuses on policy issues facing the City of Houston.
Report One. The Race for Mayor & Controller
Mayor
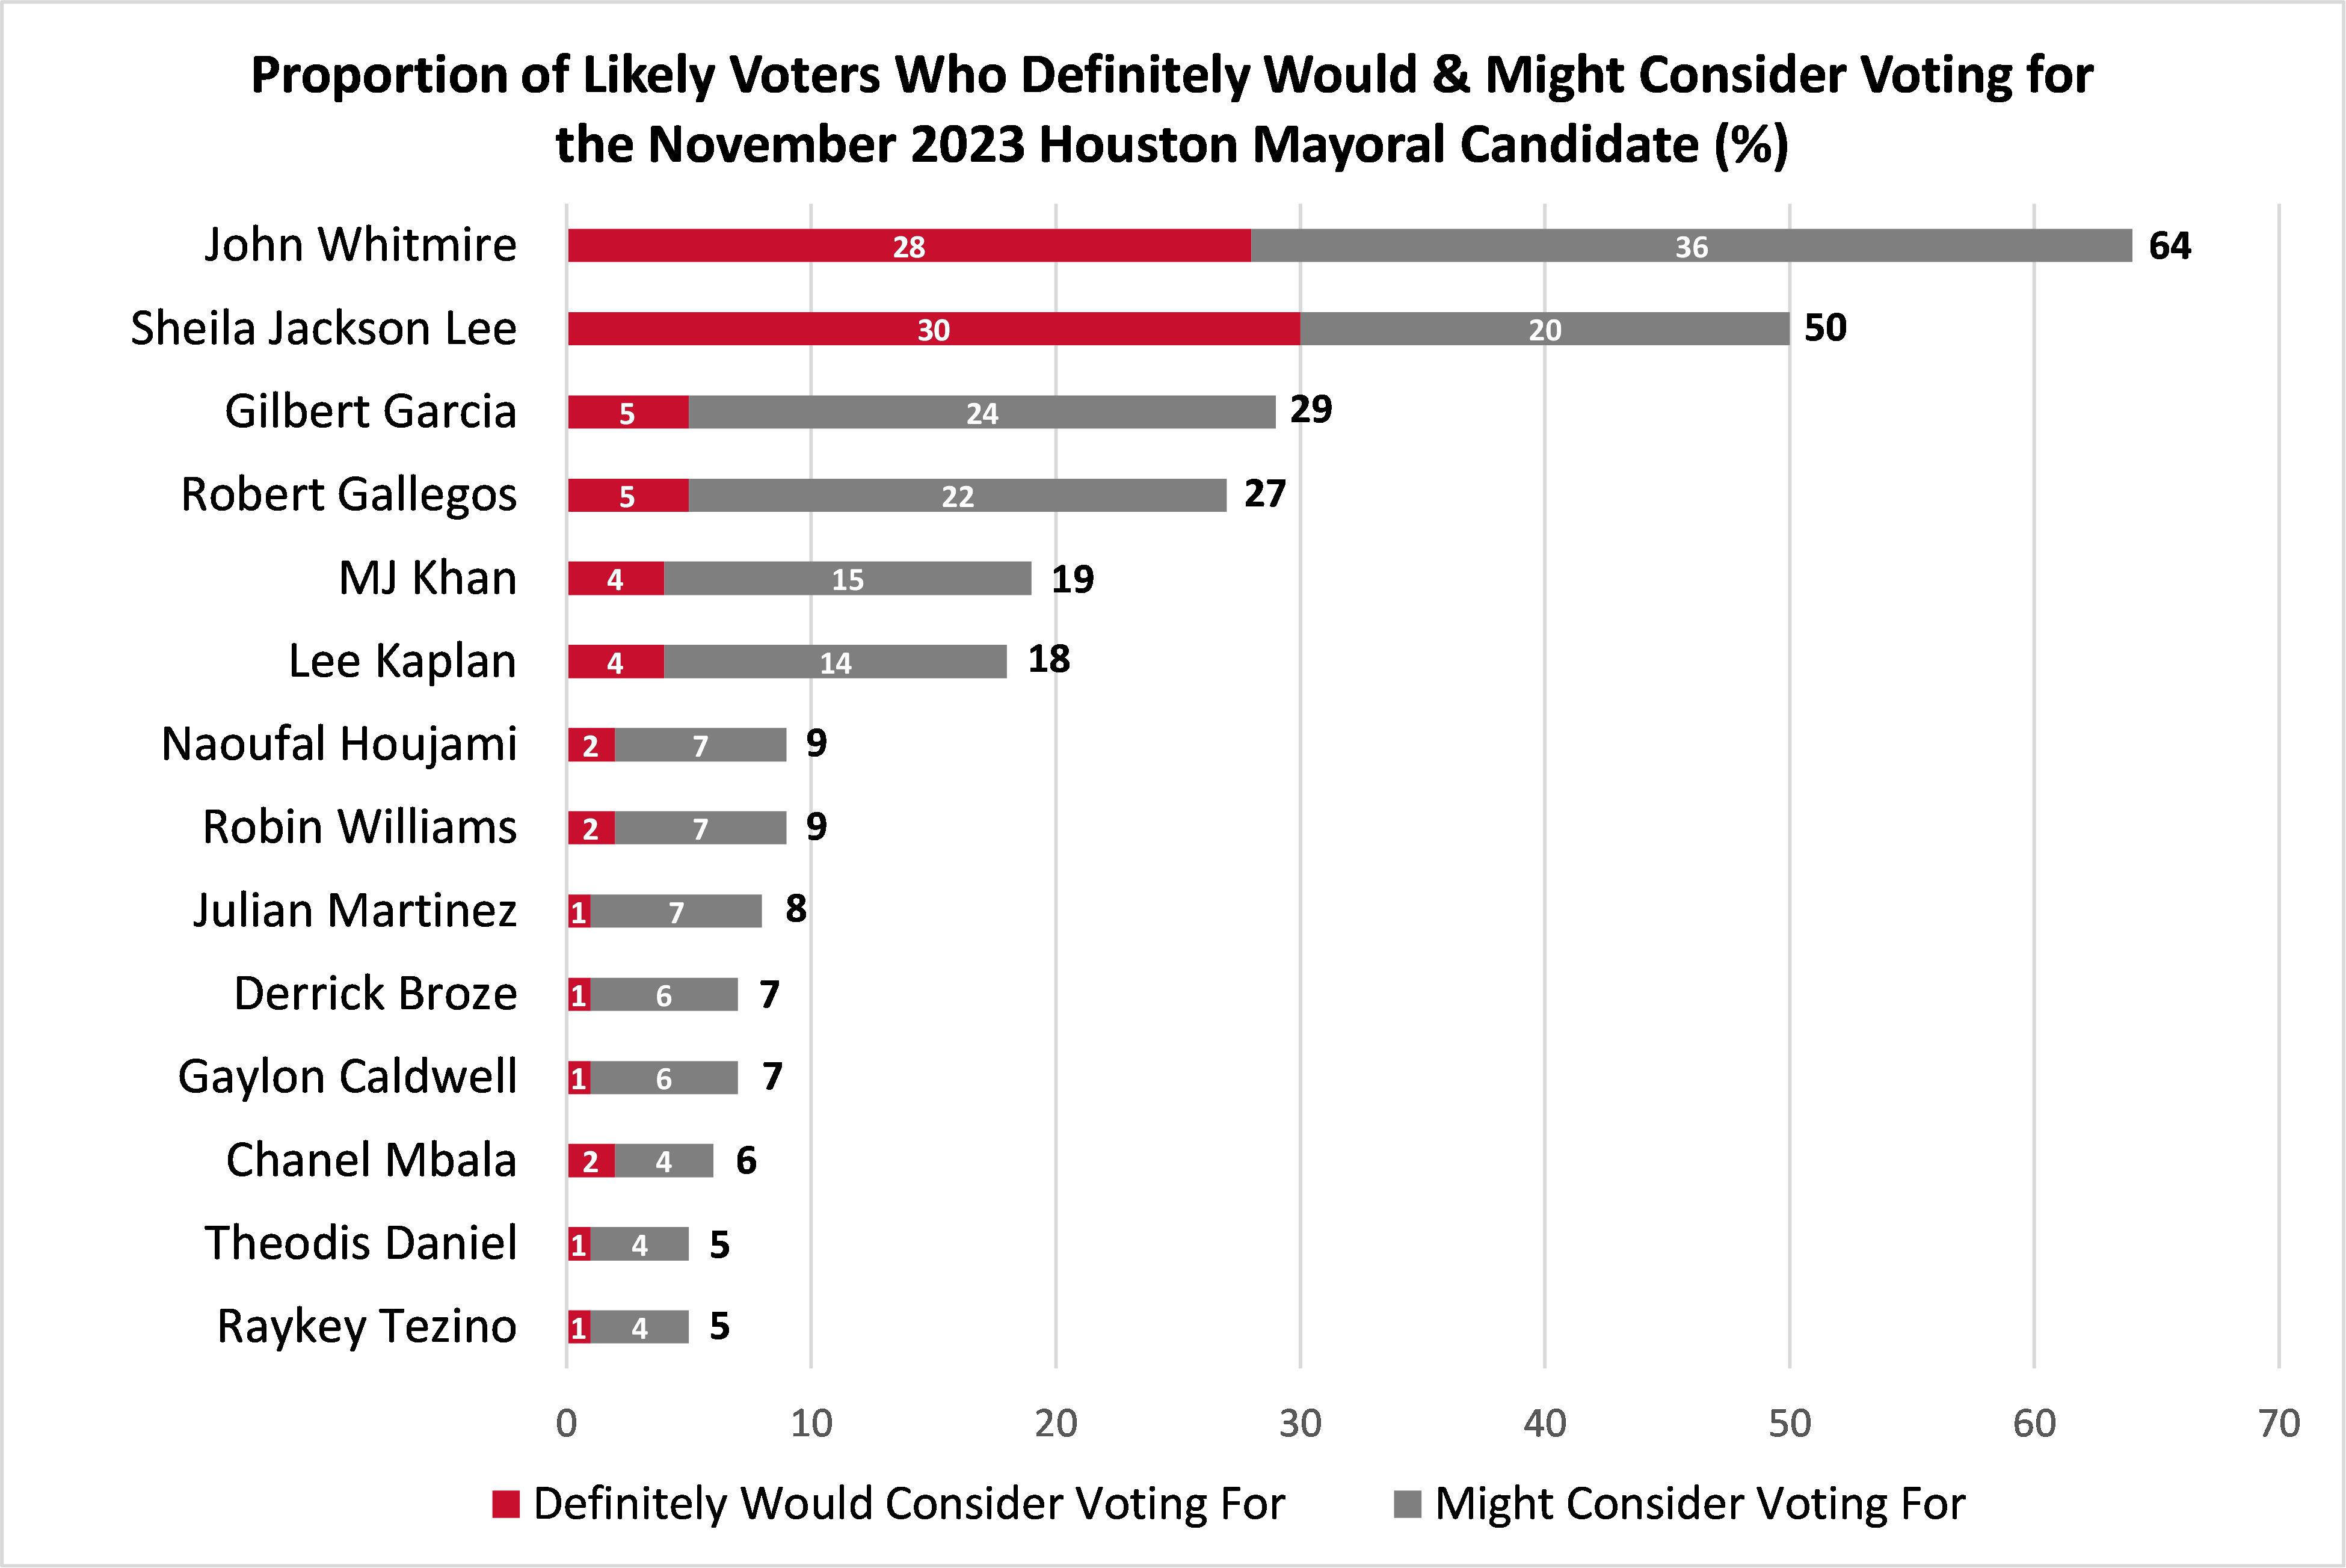
The likely Houston voters were asked if they would definitely consider voting for or might consider voting for the 14 candidates (who as of July 1 had declared to run). The candidate with the largest combined share of voters who definitely would or might consider voting for them is State Senator John Whitmire (64%), followed by Congresswoman Sheila Jackson Lee (50%), Gilbert Garcia (29%), Robert Gallegos (27%), MJ Khan (19%) and Lee Kaplan (18%). The remaining eight candidates are all in the single digits, ranging from Naoufal Houjami and Robin Williams at 9% to Raykey Tezino and Theodis Daniel at 5%.
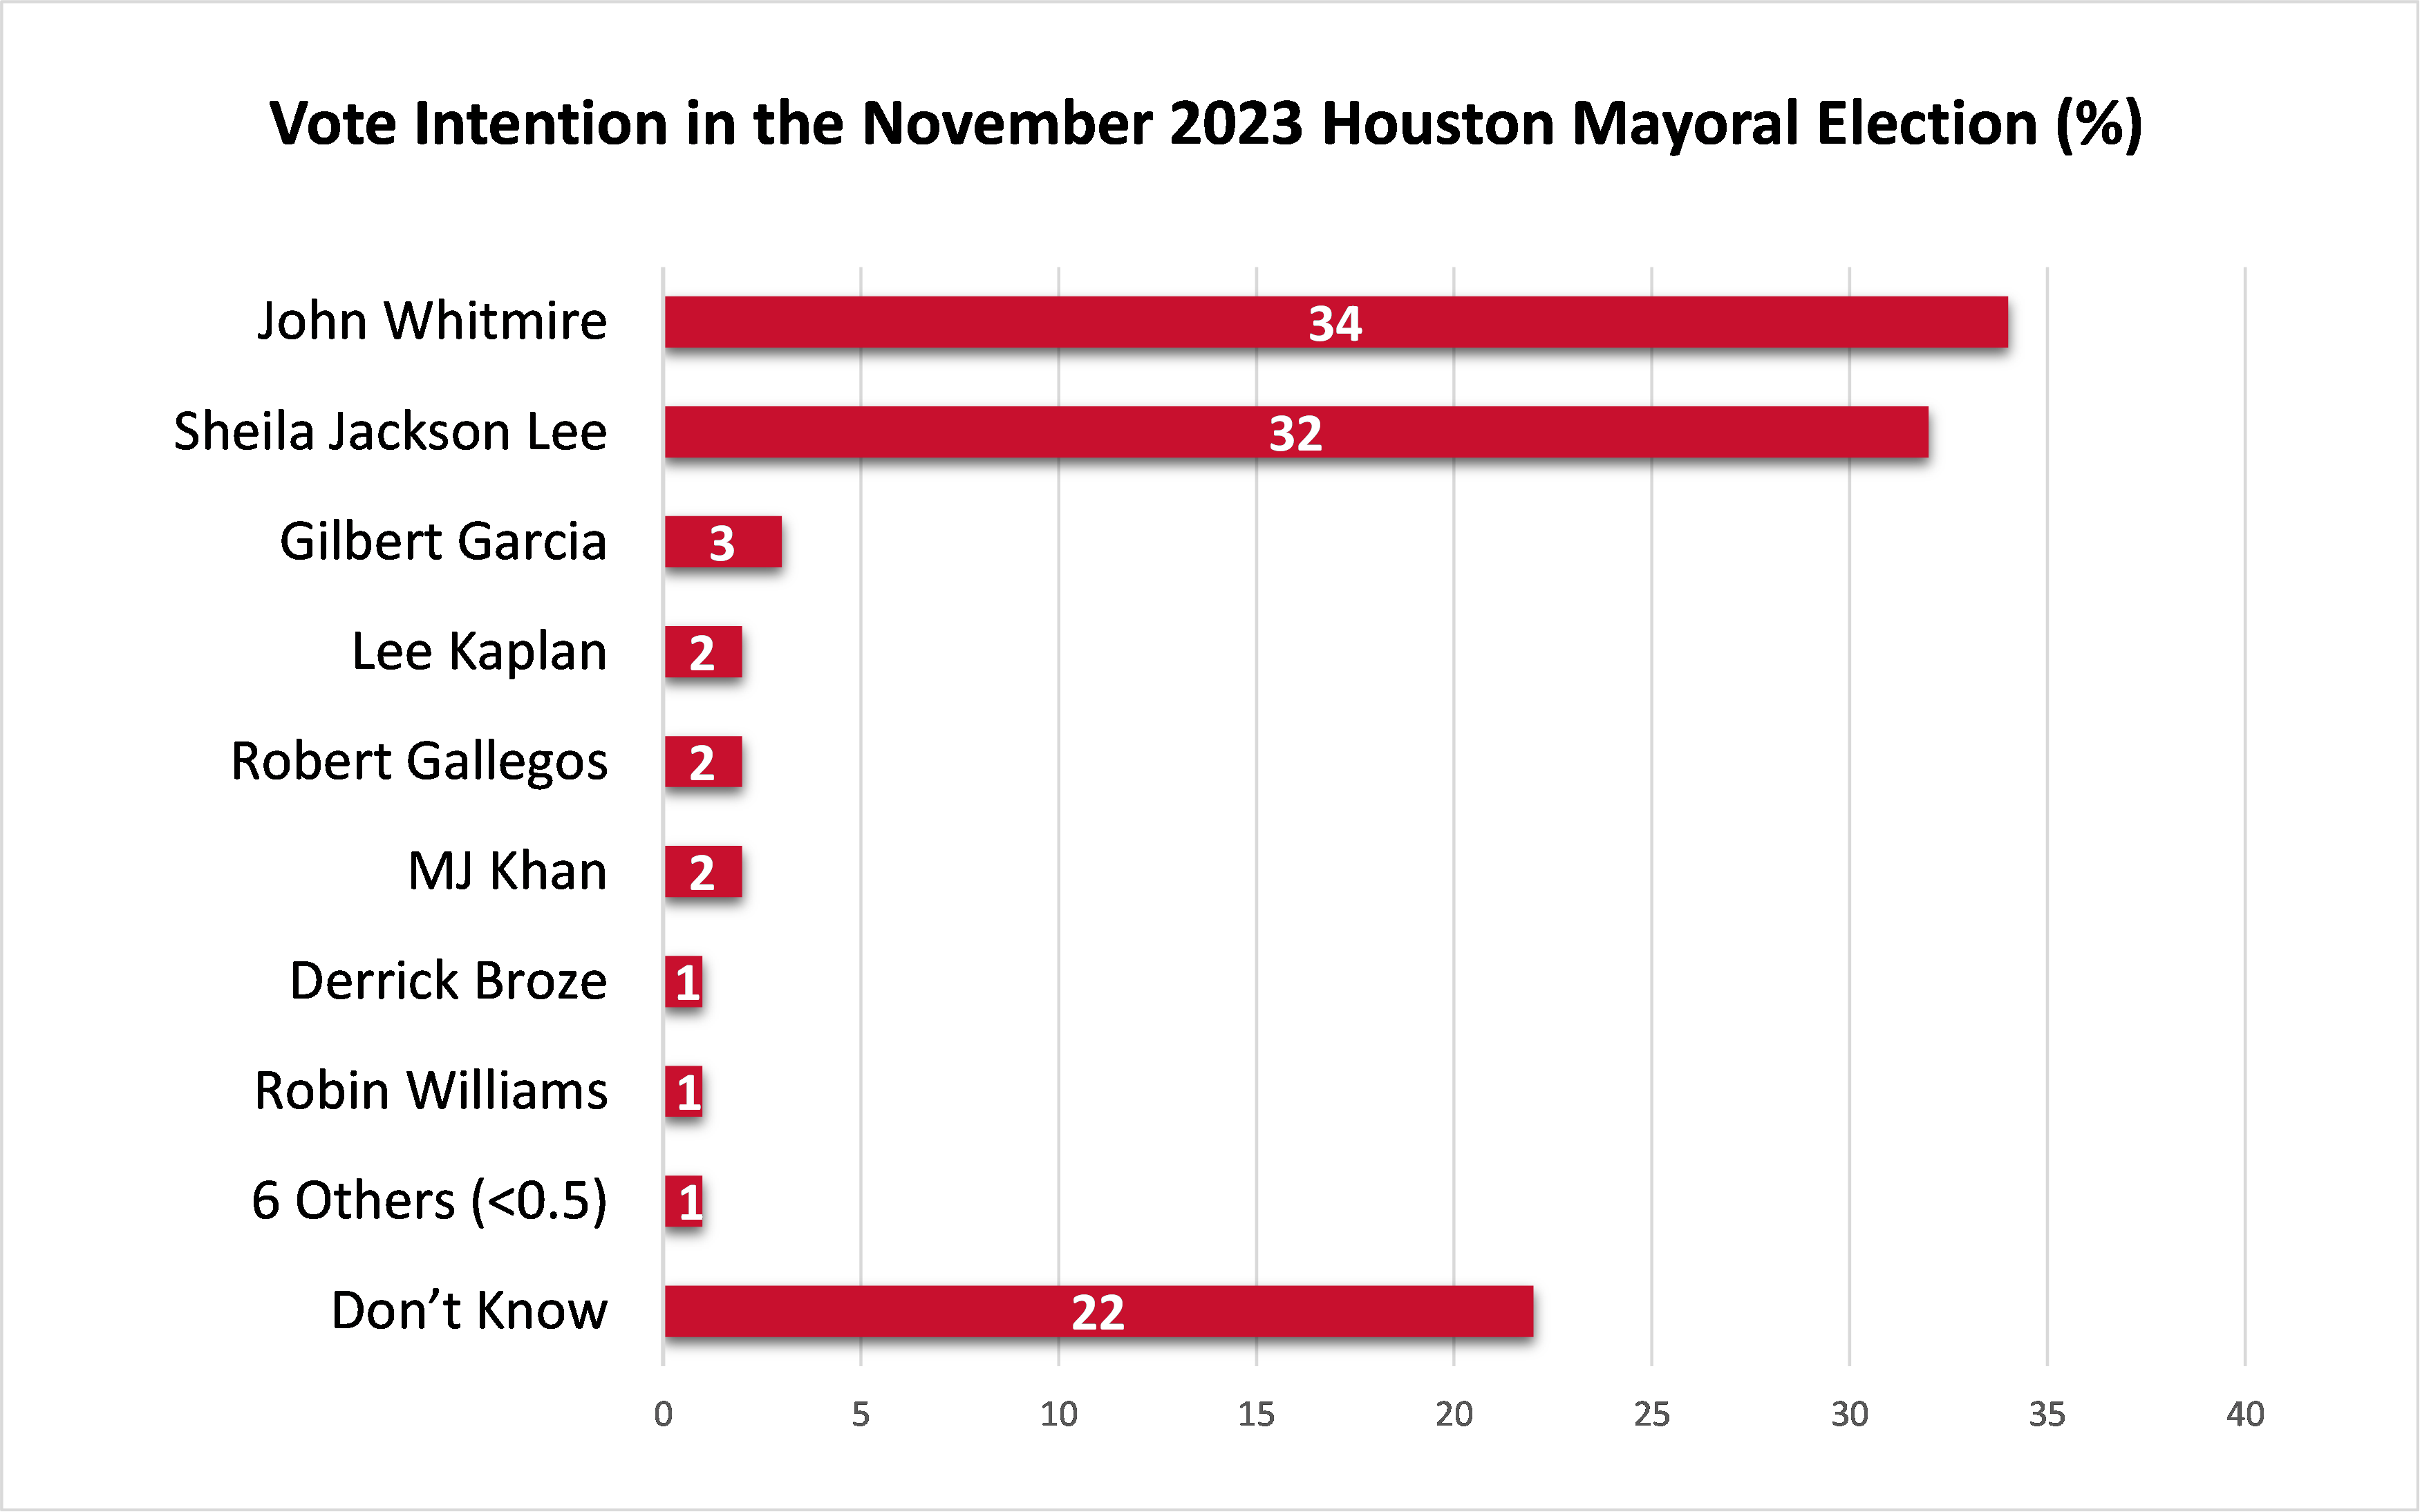
When asked who they intended to vote for in November, respondents had the option of selecting one of the 14 mayoral candidates or indicating that they did not know who they would vote for at this time. John Whitmire is in first place with 34% of the intended vote, followed closely by Sheila Jackson Lee at 32%. The vote intention for the other candidates is in the low single digits, with 22% saying they don’t know who they intend to support.
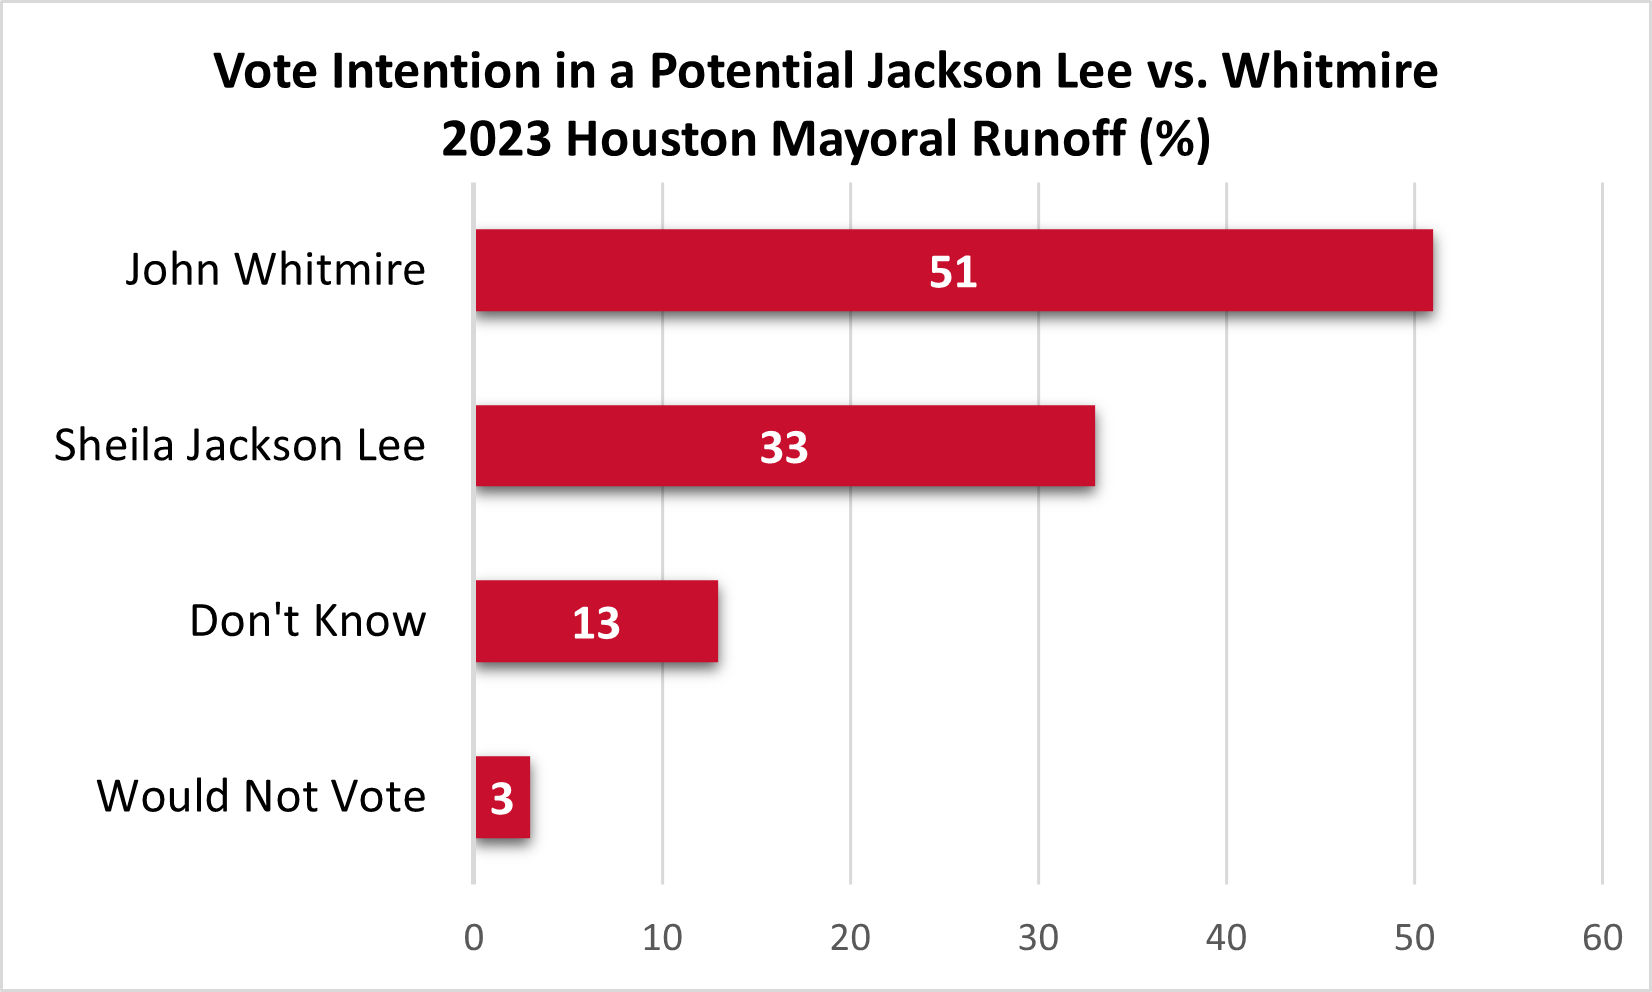
If no candidate obtains more than 50% of the vote on November 7, a December runoff will be held between the top two finishers. If a mayoral runoff election between the two current frontrunners Jackson Lee and Whitmire would occur, 51% of likely voters would cast a ballot for Whitmire and 33% for Jackson Lee, with 13% undecided and 3% indicating that they would not vote in the mayoral runoff if these two candidates were on the ballot.
Controller
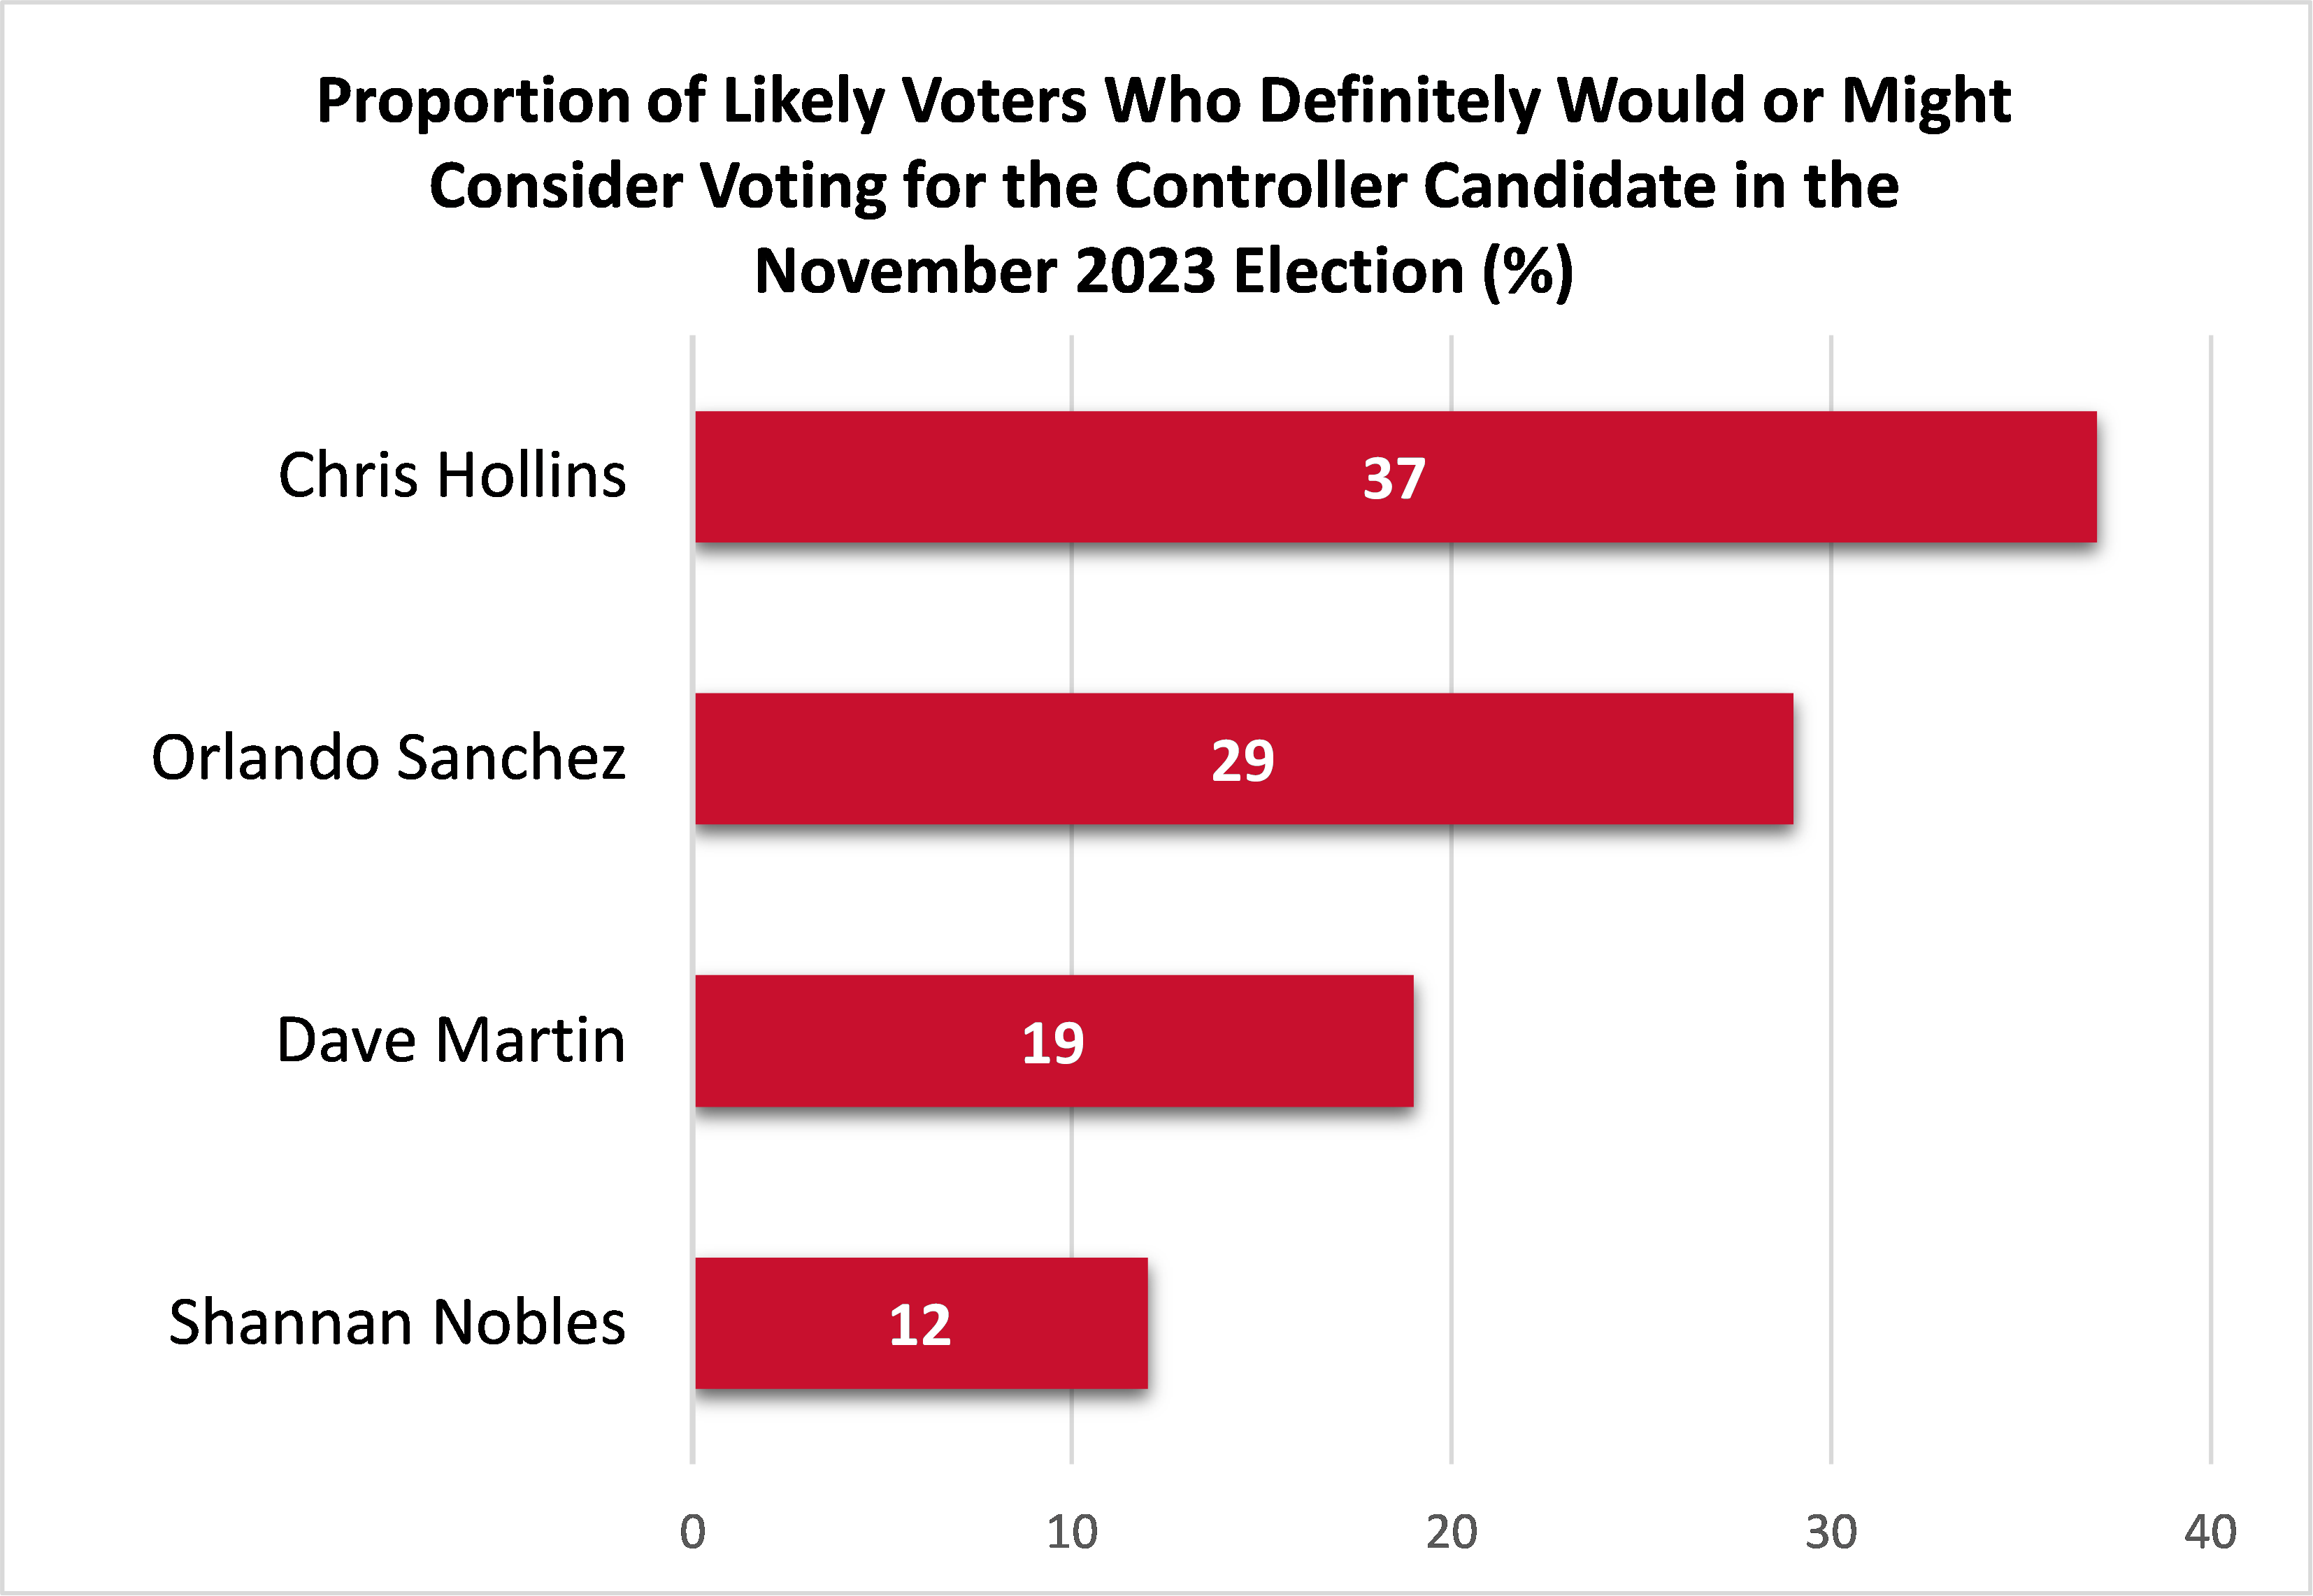
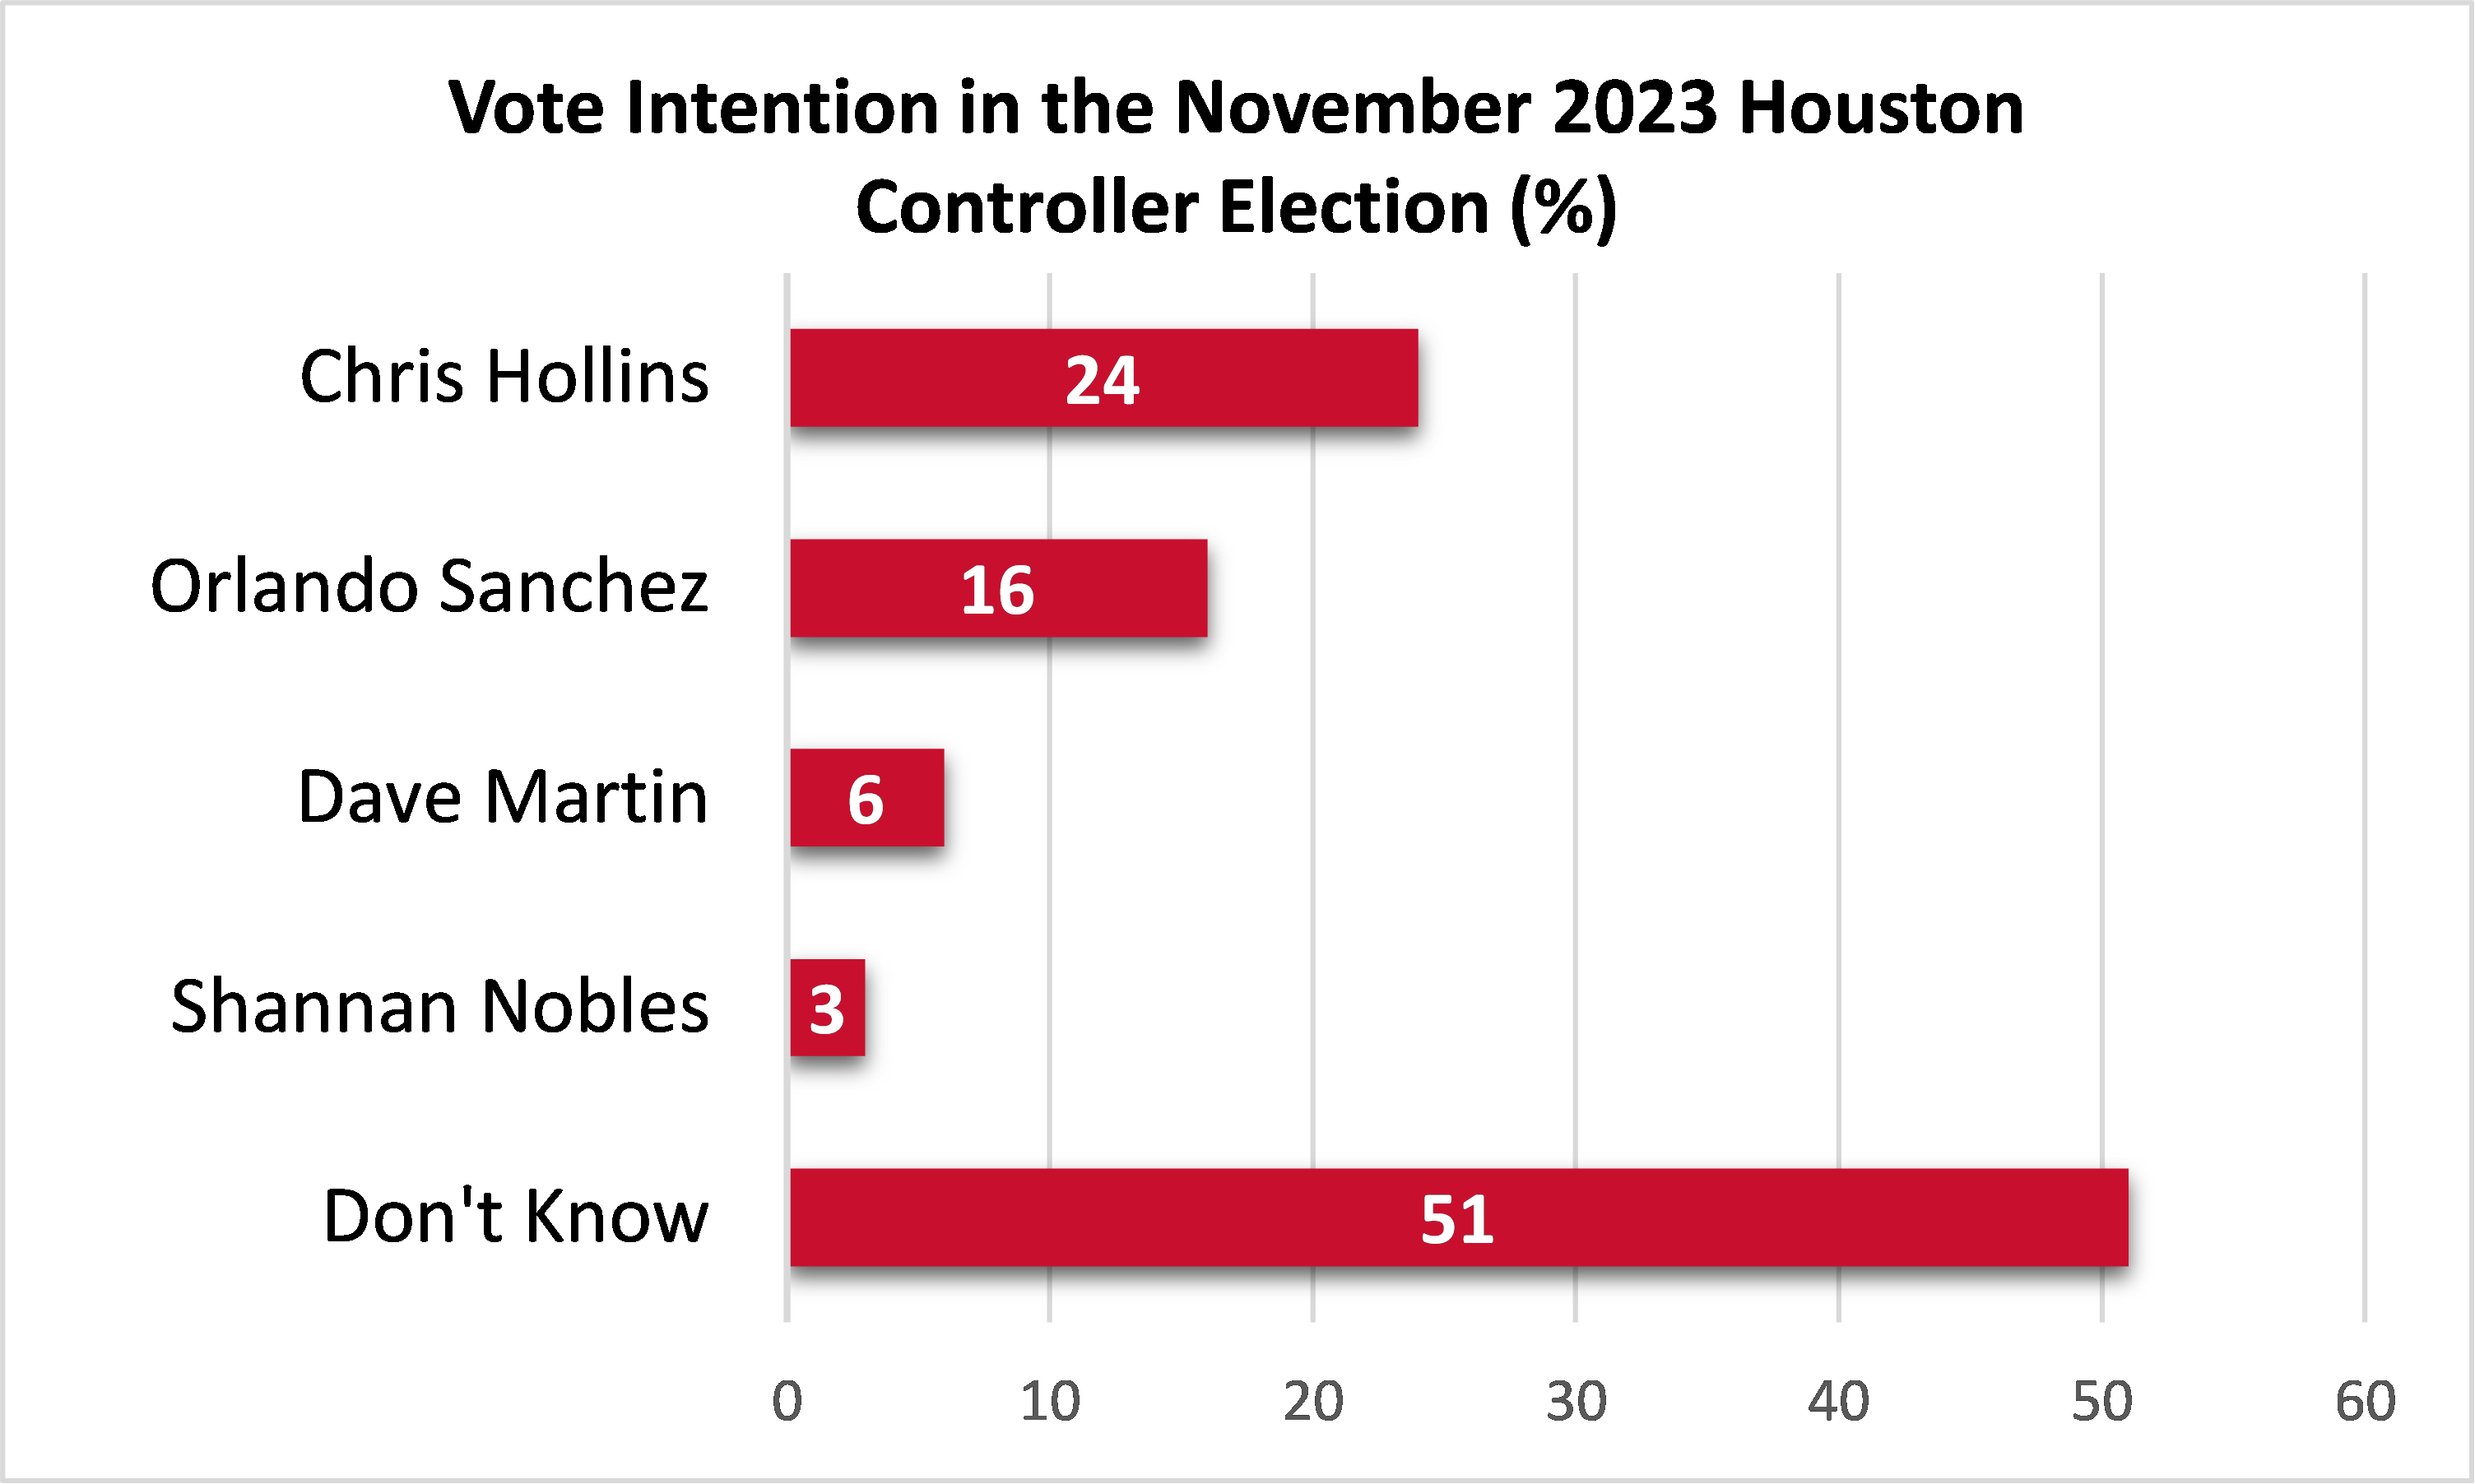
The likely Houston voters were asked if they would definitely consider voting for or might consider voting for four candidates vying for city controller. The candidate with the largest combined share of voters who definitely would or might consider voting for them is Chris Hollins (37%), Orlando Sanchez (29%), Dave Martin (19%) and Shannan Nobles (12%).
The likely Houston voters were asked if they would definitely consider voting for or might consider voting for four candidates vying for city controller. The candidate with the largest combined share of voters who definitely would or might consider voting for them is Chris Hollins (37%), Orlando Sanchez (29%), Dave Martin (19%) and Shannan Nobles (12%).
Read Report One to learn more about where Houstonians stand on the candidates for mayor and controller, mayoral runoff scenarios and favorability ratings, including differences of opinion when considering gender, age, race/ethnicity and partisanship.
Media Release July 25, 2023
Report Two. Voter Policy Priorities & Opinions
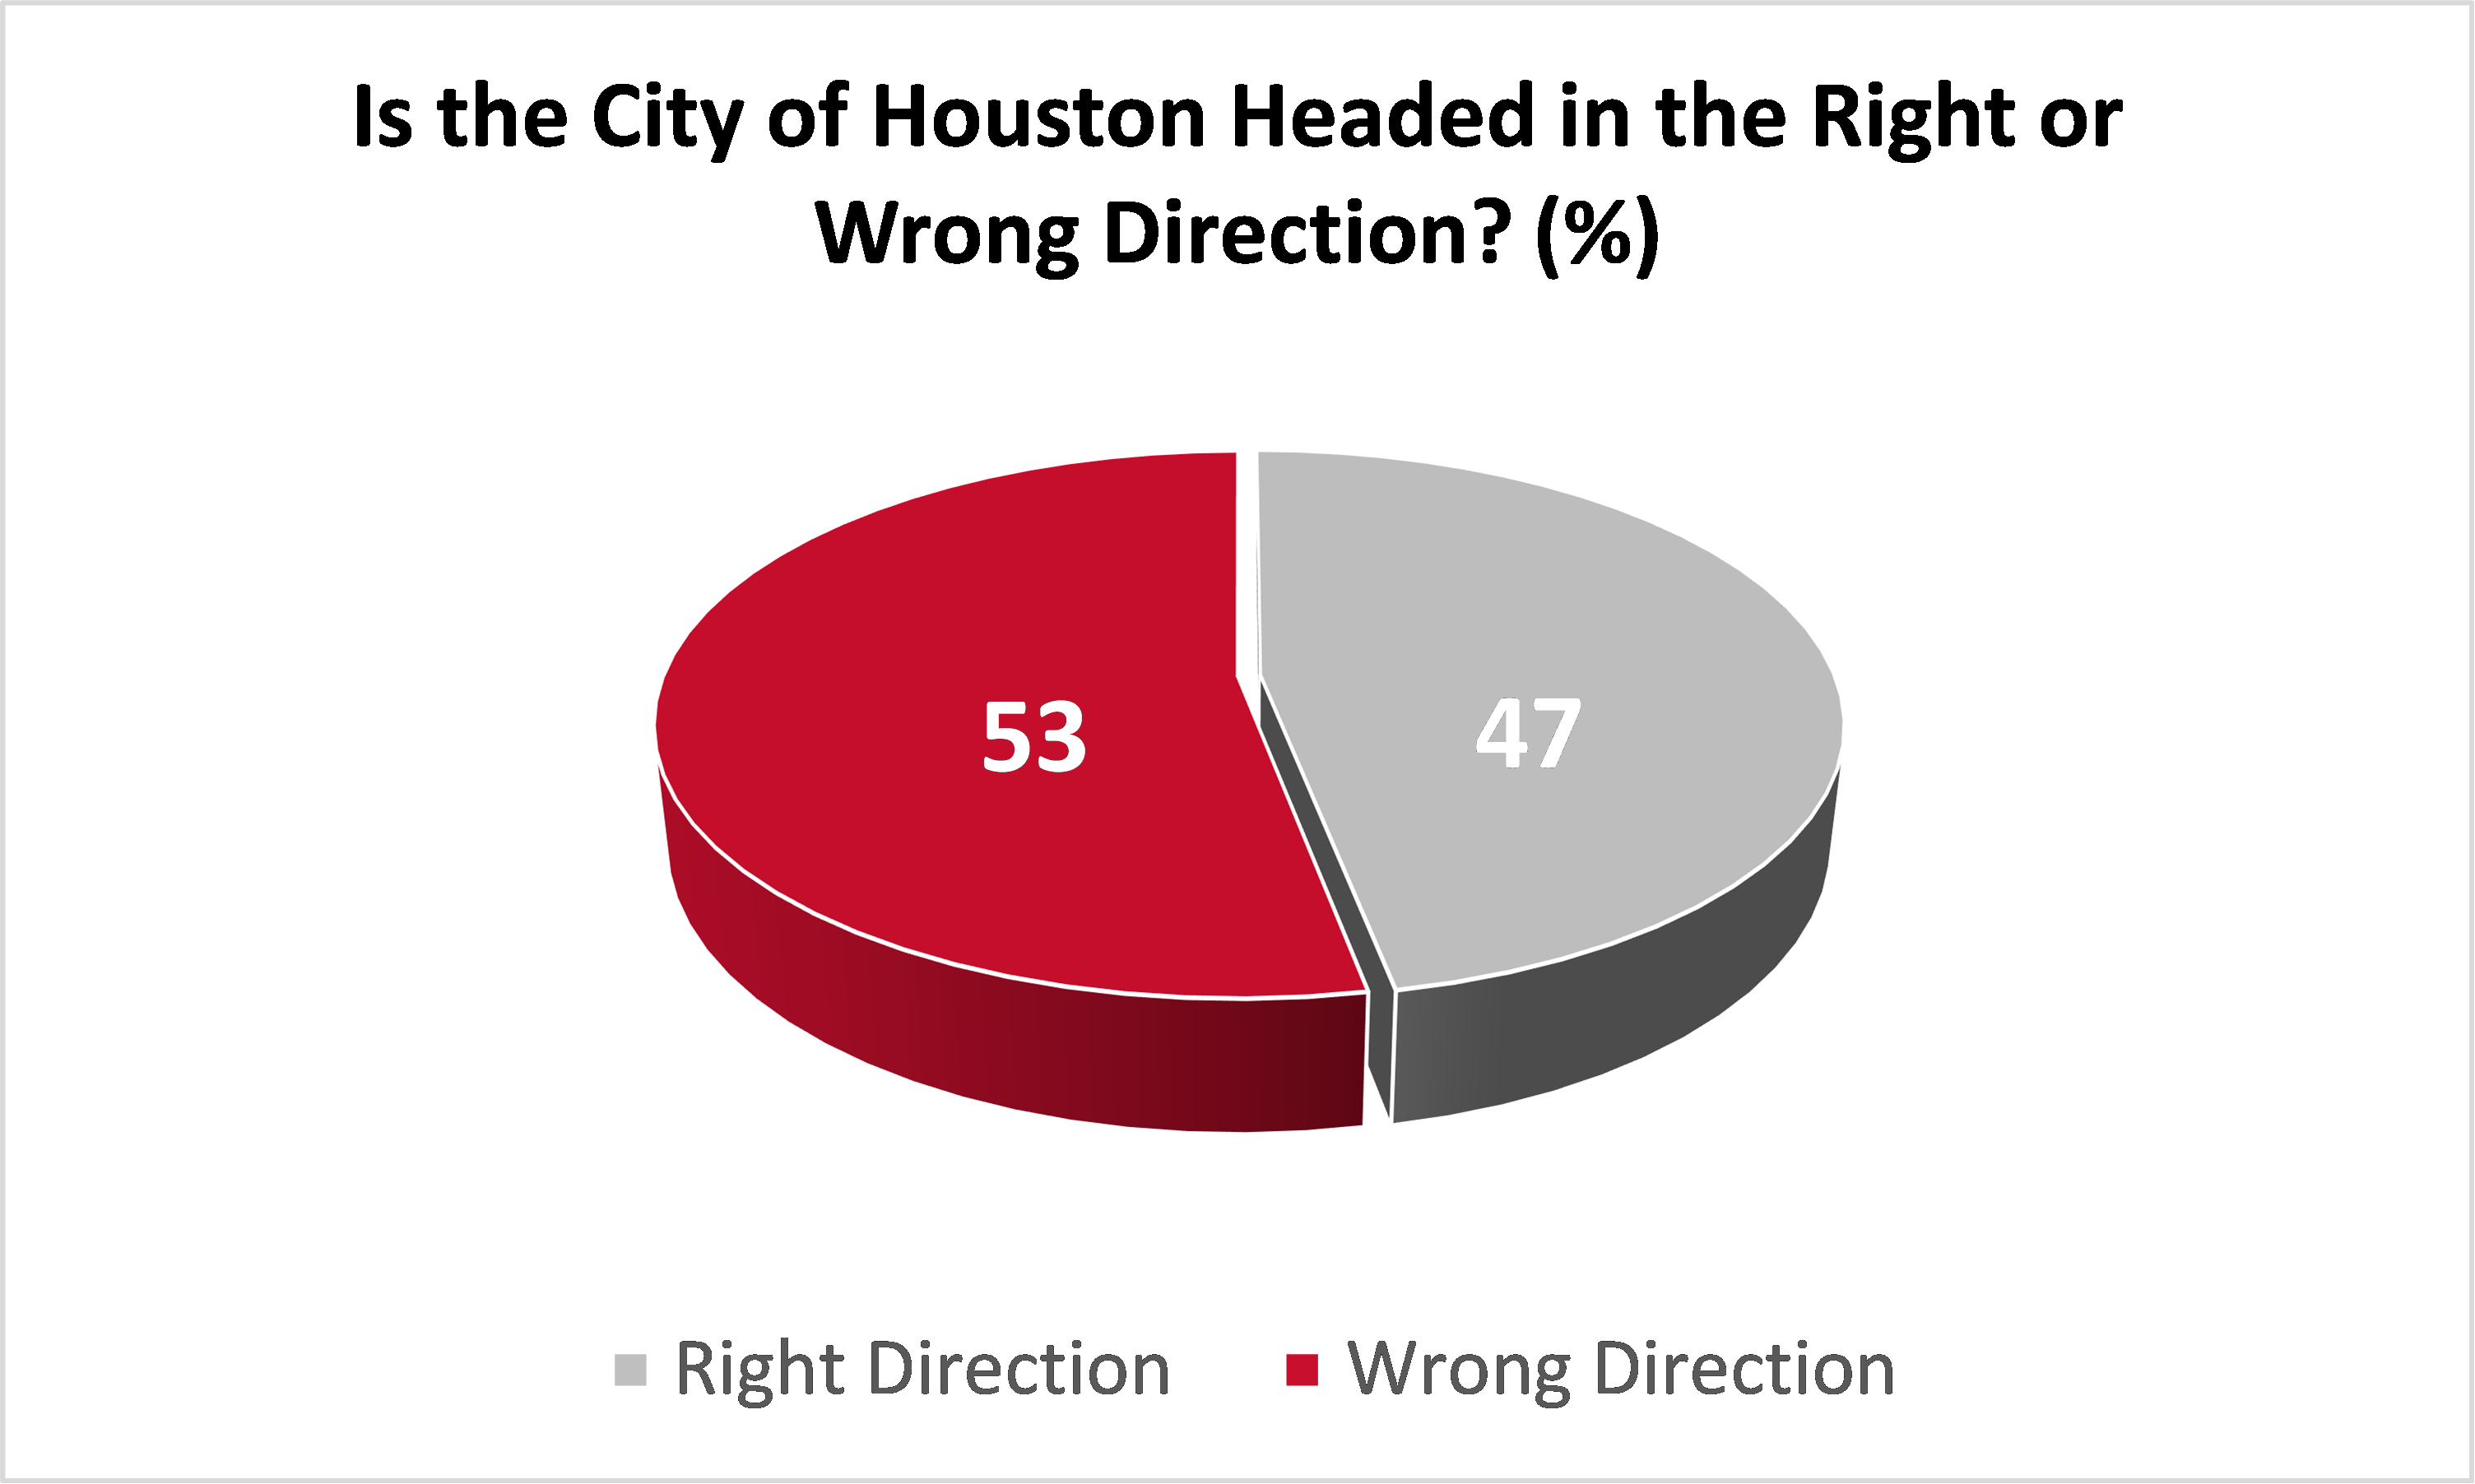
City of Houston likely voters are closely divided between those who believe things in the City of Houston are headed in the right direction (47%) and in the wrong (53%) direction.
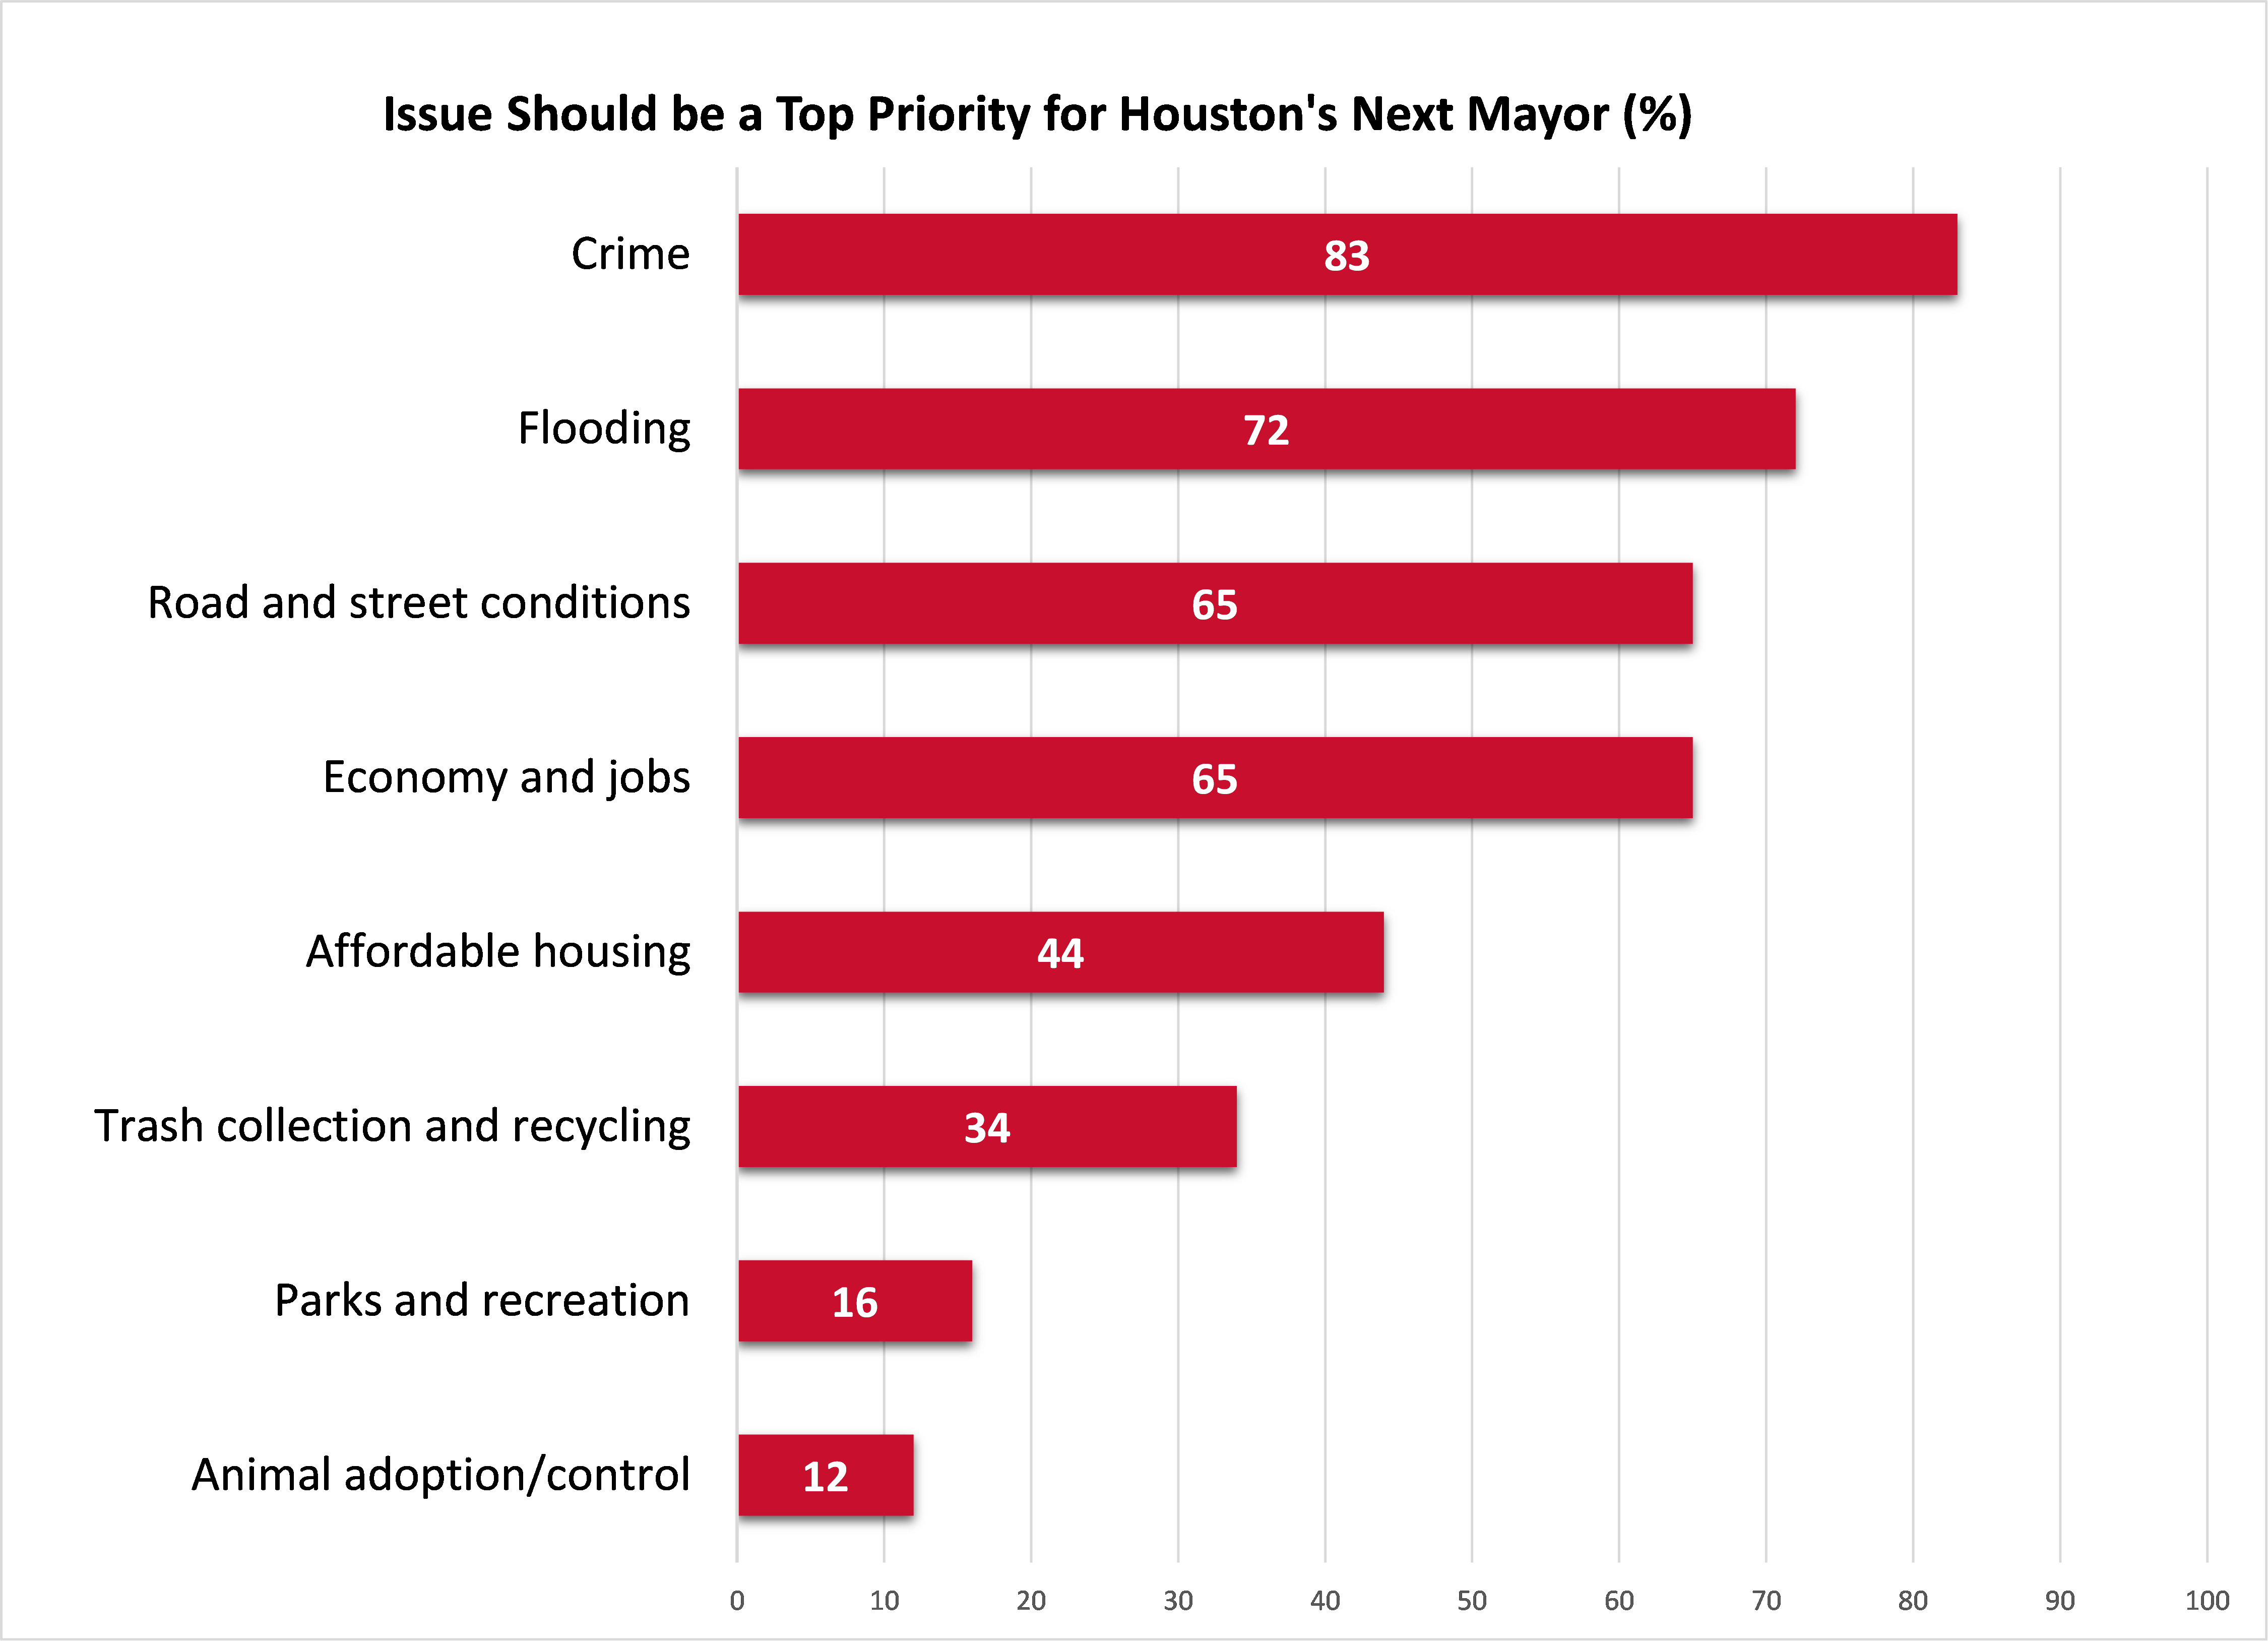
When asked about the priority of policies for Houston’s next mayor, 83% believe that crime should be a top priority, followed by 72% who consider flooding to be of the utmost importance. The third most frequently cited priorities are road and street conditions and the economy and jobs at 65%.
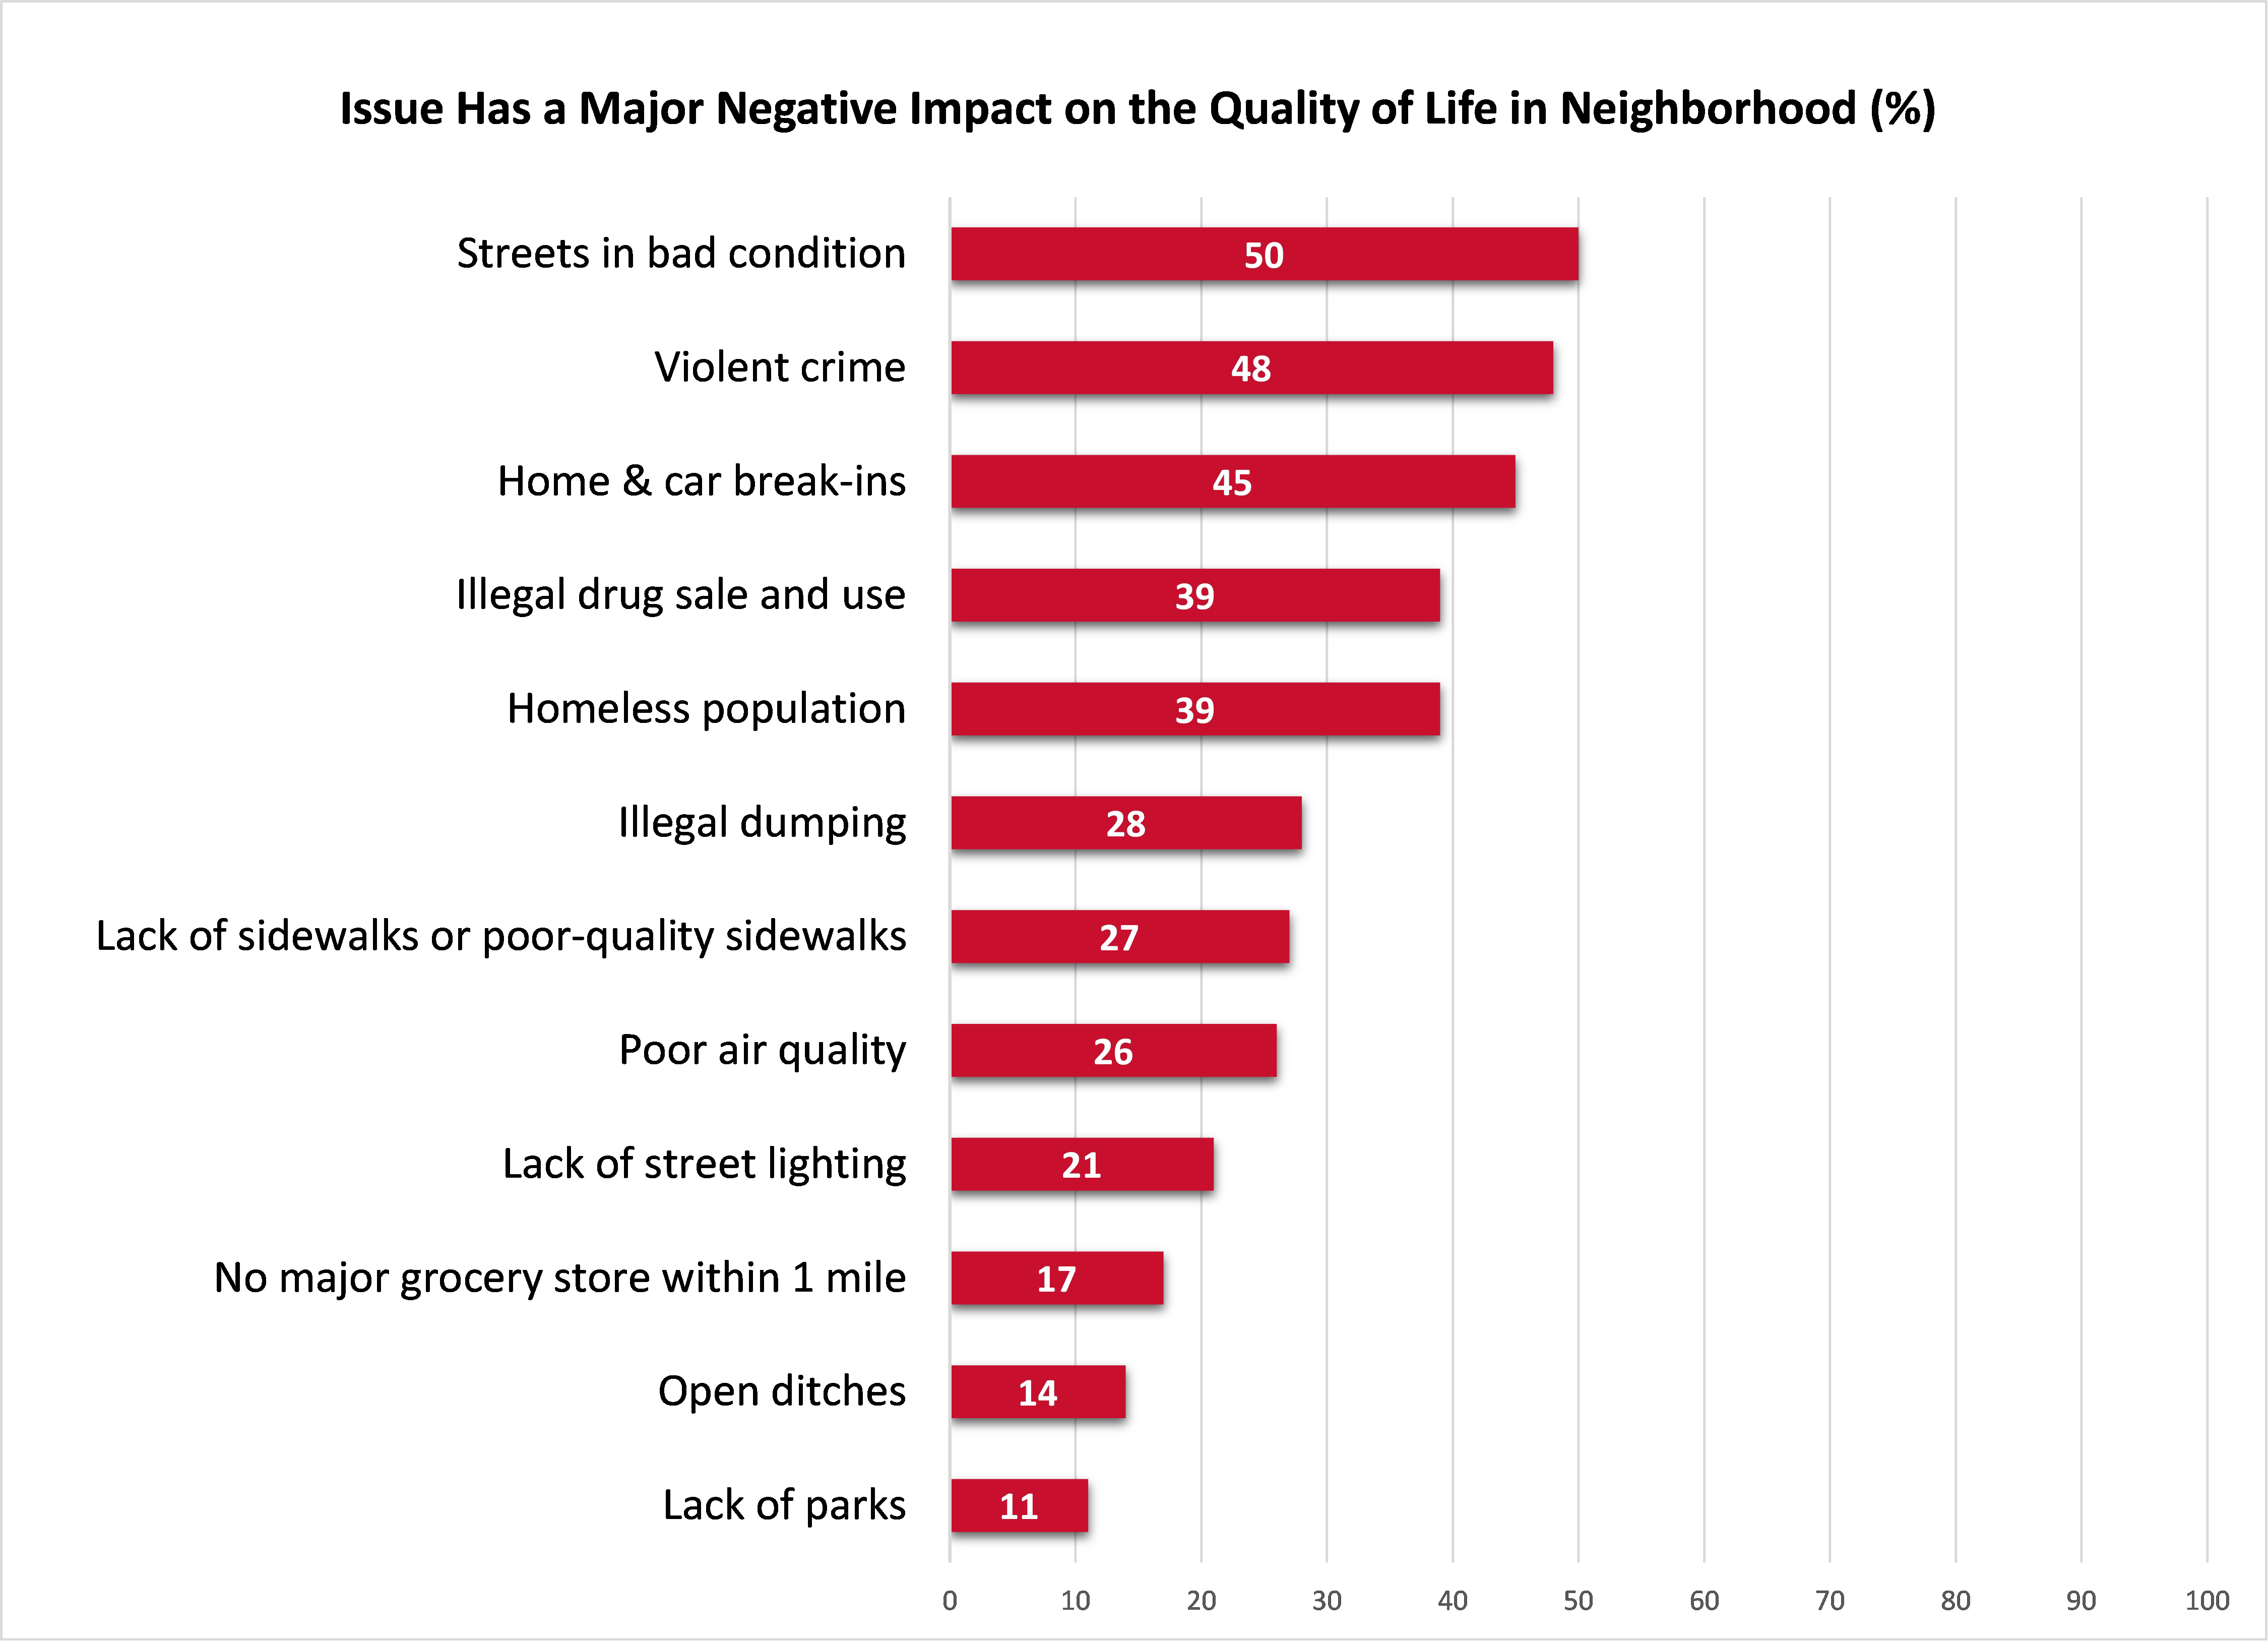
City of Houston likely voters were also asked about the impact of a series of issues on the quality of life in their neighborhood, with the proportion saying the issue has a major negative impact (as opposed to a minor negative impact, no negative impact or don’t know). The top three issues with a major negative impact include roads and streets in bad condition (50%), violent crime (48%) and home and car break-ins (45%).
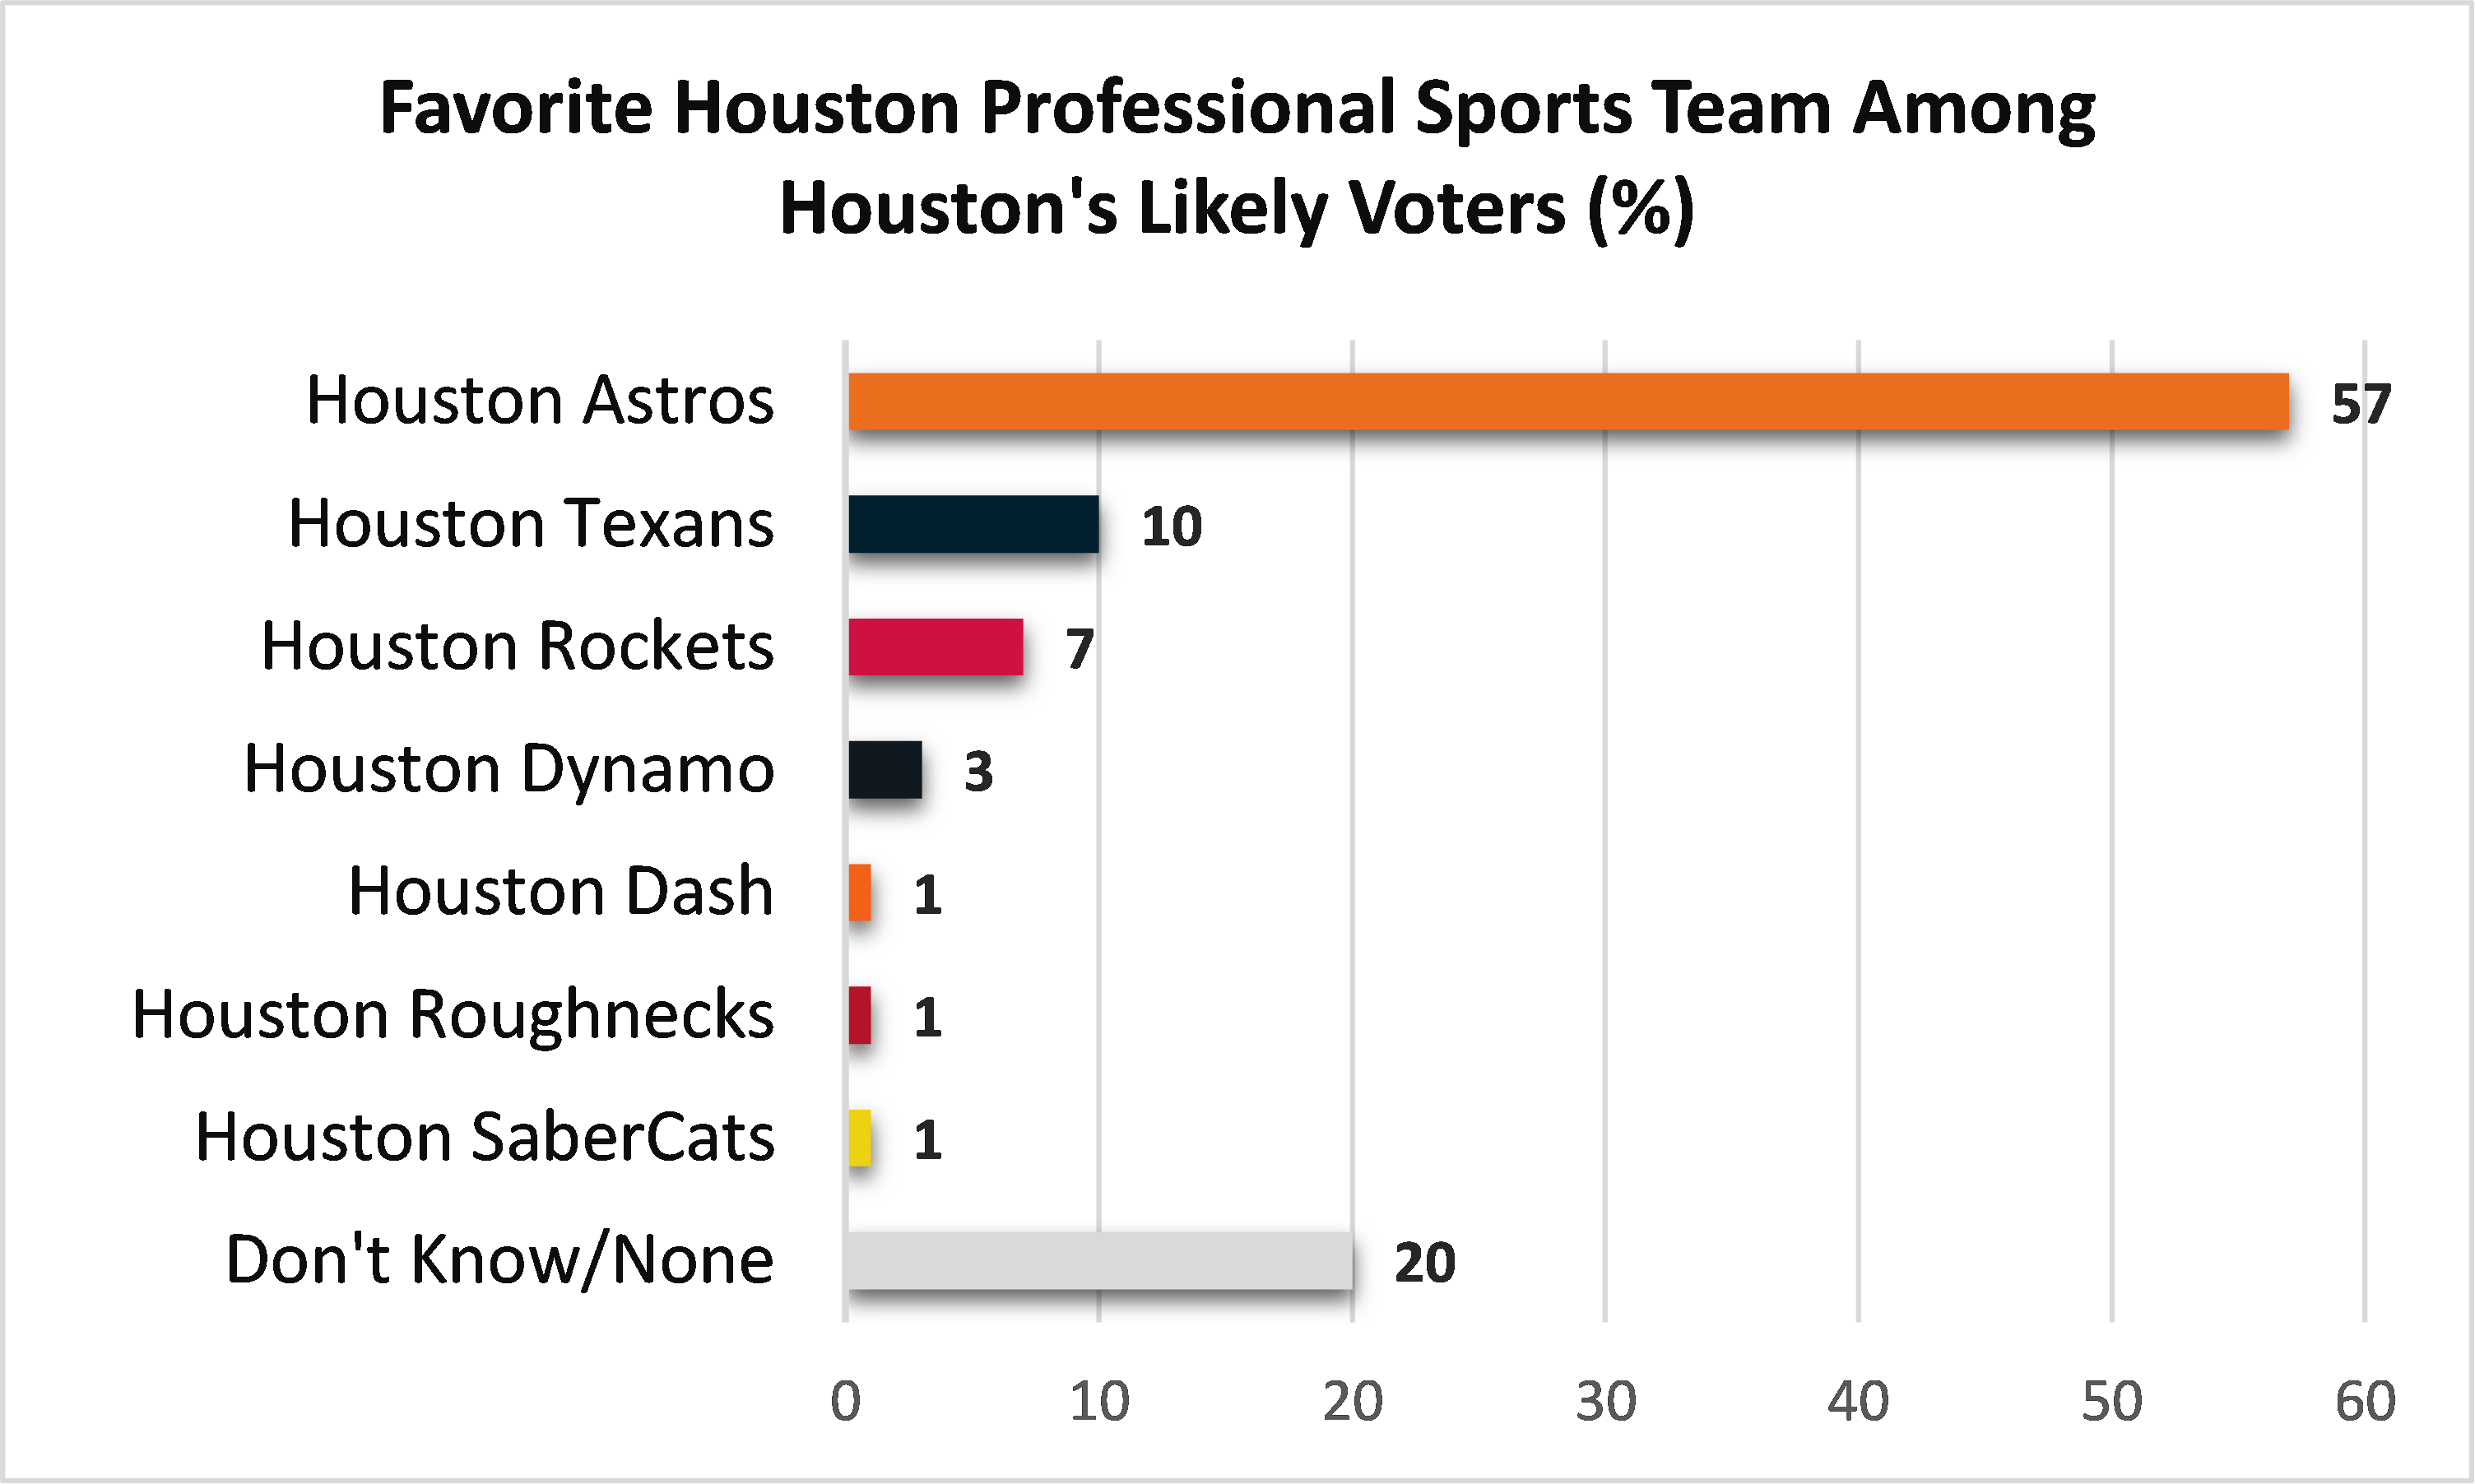
Just for fun: The Houston Astros are the favorite professional sports team of 57% of Houston likely voters, followed by the Houston Texans (10%), Houston Rockets (7%), Houston Dynamo (3%), Houston Dash (1%), Houston Roughnecks (1%) and Houston SaberCats (1%). One in five (20%) likely voters does not have a favorite team.
Read Report Two to learn more about where Houstonians stand on issues affecting Houston and opinions about public officials and other items, including differences of opinion when considering gender, age, race/ethnicity and partisanship.
Media Release August 1, 2023
Research Team
Renée Cross, Senior Executive Director & Researcher, Hobby School of Public Affairs
Mark P. Jones, James A. Baker III Institute for Public Policy's Fellow in Political Science, Rice University; Senior Research Fellow, Hobby School of Public Affairs
Maria P. Perez Argüelles, Research Associate, Hobby School of Public Affairs
Savannah Sipole, Research Associate, Hobby School of Public Affairs
Agustín Vallejo, Post-Doctoral Fellow, Hobby School of Public Affairs