1. Mission Statement and Project Overview.
2. Historical Perspective on Information Systems. (JMJ)(02/24/200)
5.1 System design
5.2 Stages in IS modeling
8. IS application models in industry (TM)(03/22/2000)
10. E-Commerce and EDI
11.1 E-Commerce (TM) (04/09/00)11. Interfaces.
11.2 Electronic Data Interchange ( EDI) (MR) (04/09/00)
11.3 E-Commerce and EDI (MR) (04/09/00)
12. Glossary of terms. (JMJ)
CHAPTER 2
HISTORY OF INFORMATION SYSTEMS (JMJ)
The history of information systems (IS) only span five decades. Yet from
its inception, IS has done more to expand business and industry into global
markets than any other convention in history. Today the backbone of IS
is know as the World Wide Web, Internet, or with a business a Local Area
Network, along with lists of acronym buzz word; EDI, EIS, ERP, SCM and
host of others to describe new ways in which IS can be employed to grow
business.
Contrary to the speed of information today, just over forty years ago, the business climate in United States was experiencing post-war growth much like it had never seen. Much of the experience that grew the economy had been learned during World War Two in tooling up the nations industries into producing an effective war machine. The field that developed out of this push to win the war was Operations Research (OR). When the war end those involved with OR were released from government work, thus unleashing an experienced and highly skilled field, like no other in history, into business and industry, which launched the US into a era of prosperity and growth that lasted over twenty-years. World War Two also saw the birth of the first practical computers or Turing Machines, which were responsible for cracking the German codes and giving the allies advanced warning of enemy movements. By today's standards these first practical computers were not that practical, half a million dollars and far less powerful than a pocket calculator which today purchased for under ten dollars. However these first computers gave Operations Researchers the power they needed to begin simulate larger and more complicated systems which in business and industry help greatly to hone uses capital expenditures into profitable ventures. This background from the early days of simulation, OR, and new technologies birthed studies into the areas of what became known as Information Systems.
When and how were they first used? Formalized?
By the mid-sixties IS was already forging its way into business mainstream. While computers remained out of reach for most businesses, telecommunications made its mark with the TELEX machine. This step gave businesses the ability to communicate within its own organization anywhere in the world at any time and effectively pass instructions and information.
The use of computer in business and industry usually started off in the accounting departments. It was assumed that this area would know the most about using numerical machines and the lack of understanding in how important databases could be other areas of the business. By this time a number of business school began developing Management Information System (MIS) programs to meet the growing need of IS managers.
During the seventies more upper management recognized the importance of IS and the flexibility it was bring to business. The TELEX became the standard of information transfer and the mainframe computer became the standard for database creation. As the need for organized and easy access to data became apparent, information based businesses began moving the mainframes from under the accounting management to it own department.
Approaches toward IS Design and Why?
As IS begins to receive its own autonomy and large budgets in corporations, many technical savvy managers of these new departments begin spending huge amount of money on systems and software at their own discretion and many time out spend all other departments without any returns to the business. These were troubling and risky times for CEO's deciding to direct the business into IS based systems . The systems and software were complex, continually changing, and the people that knew the systems tended have their own agendas. Out of this turmoil came the basis of how IS develops with in businesses.
Mainframes Vs PCs
This new rush in what is now referred to as e-mail, was brought about by the invention of the mini and micro computer, which could put and entire system on an executives desk for a very low price compared to mainframes and the ability to have an autonomous system with out pay huge amounts of money to process information. Once again turmoil enters the relationships of IS and businesses, where software and hardware vendors begin making demands on businesses to switch there style of business to fit the computer systems. There was little standardization of software and hardware with many start up companies that went under there after leaving business with out any technical or system support, resulting in spending above budgets to install entirely new systems. As the desire to support different departments of a corporation with IS and the new affordability of hardware and software each department began to put IS programs together independently of MIS department. This result in a new position in companies: Chief Information Officer (CIO), a position that in many companies at this time rivaled the CEO. The need for this position was to standardize all of the electronic data interfaces (EDI) between all departments so information could be more efficiently.
Quality Initiatives in IS Development
The mid-eighties were the time most manufacturing companies began to shift to IS to forecast sales, take orders, and manage distribution of products. Time Berners-Lee developed the World Wide Web in 1989. This protocol HTML used over the existing Internets that had been constructed opened up a new era of EDI the world had never seen. Where by the mid-1990's it became apparent that there is no way for a corporation to efficiently do business without a solid functioning IS setup inside its own walls as well as connected with its supply-chain vendors and distributors. EDI once known as Electronic Data Processing (EDP) have now brought profit margins so low that any business that does not prepare itself will be out of business in the next five years.
IS is a technology driven system. With out it, business would not be what it is today. It has evolved over the past forty years to being the back bone of business, yet the simple application rules created in the 1960s and 1970s are still very relevant in any application where data or information is transferred in what ever business model it is applied to no matter the complexity.
CHAPTER 3
Basically an Information System handles the flow and maintenance of information that supports a business or some other operation. It contains information about significant people, places and things within the organization or in the environment surrounding it. Information is derived from meaningful interpretation of data. Data consists of the raw facts representing events occurring in the organization before they are organized into an understandable and useful form for humans.INFORMATION SYSTEMS - AN INTRODUCTION (TM)
A system which assembles, stores, processes, and delivers information relevant to an organization (or to a society), in such a way that the information is accessible and useful to those who wish to use it, including managers, staff, clients and citizens. An information system is a human activity (social) system, which may or may not involve the use of computer systems. Also, in addition to supporting decision-making, information systems help workers and managers to analyze complex problems, to develop new products and to integrate the various modules and departments. Moreover the 'transmission losses'n inter-departmental communication are reduced considerably leading to better coordination and improved transparency (information sharing) within the organization as a whole.
Three activities provide the information that organizations need. These activities are Input, Processing and Output. 'Input' consists of acquisition of the 'raw data', which is transformed into more meaningful packets of 'Information' by means of 'Processing'. The processed information now flows to the users or activities also called as 'Output'. The shortcomings are analyzed and the information is sent back to the appropriate members of the organization to help them evaluate and refine the input. This is termed as 'feedback'.
Examples
of 'Information Inputs' would be Transactions, events which would undergo
'processing' in the form of sorting, listing, merging and updating resulting
in 'outputs' such as detailed reports, lists and summaries. Another example
would be in the manufacturing environment with 'information inputs'
such as design specs material requirements and the SOPs (standard operating
procedures). These would be 'processed' by the information
system by modeling and simulation techniques and would result in standard
production models along with the overall cost of the production process
which is calculated by the information system from the knowledge base containing
material costs, hourly labor costs and other indirect costs. Hence almost
totally eliminating a distinct costing function in the scheme of things.
However an information system cannot just be broadly described as an Input-Process-output mechanism in vacuum. It is required to provide major organizational solutions to challenges and problems posed in the business environment. Hence a manager needs to be not just computer-literate but also have a good idea of the organizational structure and functions as a whole. This concept is illustrated in the figure on the opening page.
Also,
at the heart of the issue Information systems should not be confused with
information technology. They exist independent of each other and
irrespective of whether they are implemented well. Information systems
use computers (or Information Technology) as tools for the storing and
rapid processing of information leading to analysis, decision-making and
better coordination and control. Hence information technology forms the
basis of modern information systems.
3.1 Types of Information Systems
Types of Information systems
(Source: Management Information Systems, Laudon and laudon)
The six major types of information systems corresponding to each organizational level (the four levels shown in figure above) are:
1. Transaction Processing Systems (TPS): serve the operational level of an organization.
2. Knowledge work systems (KWS)
3. Office automation systems (OAS) to serve the knowledge level of an organization.
4. Decision-support systems (DSS)
5. Management information systems (MIS) serve the management level of the organization.
6. Executive support systems (ESS) serve the strategic level of an organization.
(Source: Management Information Systems, Laudon and laudon)
CHAPTER 4
DEVELOPMENT OF INFORMATION SYSTEMS (TM)
As mentioned earlier, every company to start with, has an information system
already in place, be it a file card and pencil based system, a computerized
system or an intermediate of the two. Hence the IS development process
involves work on an existing system - mapping the system, automating it
and making sure that it functions according to user requirements. Hence
in its first phase the process attempts to determine the scope and type
of new system that the user wants. The next phase analyzes the above requirement
in two parts to facilitate detailed verification and validation before
the system is actually designed and implemented.
Infact the entire concept of Information systems development revolves around the users - their needs, performance expectations, requirements and other specifications. The very succcess or failure of an information system may be measured by the level of satisifaction of its basic users in the organisaiton. It is very essential that the database satisfy the requirements of the user, otherwise he or she will continue with his or her own system and thereby defeat the purpose of the central database. The key element in this concept is that each subsystem utilize the same database in the satisfaction of its information needs. This will yield an additional significant advantage - the integration of departments and functions. Thus each department, through its access and interface with the total information resources of the company, gains a greater understanding and appreciation of how its actions and plans affect others throughout the organization.
An important question that can be raised is why is it important to analyzeand design information systems before you build them. Why can't you build the information systems directly? The main reasons are:
1. It is important to build the information systems that the users really need. You dont know what they really need if you dont start with some kind of analysis and design.
2. It is a waste of resources to build information systems without sufficiently good "blueprints" because it takes more time and yields worse results if you dont have blueprints.
Analysis and design is performed to meet information needs. If it is required
to arrive at models that describe information systems that the users really
need, then interest groups (or user groups) generally have to participate
in the work. Another reason for performing analysis and design is that
those who participate in such work learn much about the new information
systems. To be able to use information systems requires knowledge about
how these systems work. Participating in the analysis and design work is
one way of obtaining such knowledge.
4.2 Determining need and performance expectations
As every company has an existing system and the process of IS development involves system conversion. The general steps involved in the conversion are:
1. System Description
(narrative or pictorial)
2. Input Documents
( item description, layouts etc.)
3. Output Documents
( report formats, output requirements etc.)
4. File Design (involves
the system design process explained in the next section)
5. Program Logic (by
the use flow charts or other methods)
6. Computer Program
(COBOL,DYNAMO,BASIC,PASCAL,FORTRAN to name a few )
7. System Verfication
8. Documetation
Potential problem requirements surrounding database construction are generally those connected with interdepartmental coordination and agreement. These might include :
- possibility of invalid input of information by a unit wishing to maintain information security.
- the "multiplier effect"
of erroneously entered data, which has an immediate influence on other
departements
utilizing the data.
- the "time dimension" of
input data, which requires that user departments agree on the time during
which a
transaction should
be reflected data input.
- the "interdepartment agreement"
required concerning the degree of detail to be included in data elements
of the
database.
As a consequence of the above problems that have been identified
some of the desired features of the system
would be :
- Simplicity or ease of usage and handling (by employing graphic
user interface - based entry and retrieval
systems)
-
Adequate security features/firewalls for restricitng unauthorised access
(both within the organisation and
on the web) and
- A very rigid backbone-operating system to support the numerous organizational
functions at
different levels.
A clear-cut knowledge of the expectations or requirements of the system
being developed would entail a listing of some performance metrics. The
measurement of costs or benefits is a measurement of change between the
old and the new. In other words we may measure the change in the total
output of the system or measure the many changes accomplished throughout
the system. The former is obviously the most desirable.
It is probably rare that a measurement of the total system is attempted
at the system level. Some broad concepts that need to be kept in mind during
system development include :
1. System Integrity : How well are the sub
systems integrated into the total system without redundancy ? How flexible
is
the system ? How easily may the system be
expanded ?
2. Operating Integrity : How skilled are the people
operating the system ? What back-up is there to prevent system
breakdown in the event of loss of key personnel
or equipment failure ?
3. Internal Integrity : How well does the system
do what it is supposed to do ? How valid are system outputs ? How
secure is the sytem against human error, manipulation,
sabotage or theft ?
4. Procedural Integrity : How good is the documentation
of the system and procedures ? Are procedures such that
employees are motivated to follow them ? How well
are procedures followed in practice ? What controls ensure
that procedures are followed ?
- Change analysis has to be performed before information
systems development is performed. Change analysis is the analysis of suitable
changes of the activities of an enterprise in concrete situation. The purpose
of change analysis is to formulate the problem before you start to solve
it. Developing information systems is effective only if you have information
system problems or needs. Problem oriented work must be performed before
data oriented work is performed.
Problem-oriented
work in information systems development refers to the development
parts whose purpose is to specify what the information systems will do
(seen from the users' view). Data-oriented work refers to
the development parts whose purpose is to design technical solutions to
this specification. It is only effective to perform data oriented work
if you have a problem-oriented specification as a basis.
The concept is explained in further detail in the first phase of process
design,( i.e requirements analysis.)
4.3 Characteristics of good organisational IS talent
A manager needs information for a variety of reasons concerned with the management process. The type of need that he or she will have at various times and for various purposes depends largely upon 2 factors that we shall examine briefly : the personal managerial attributes and the organizational environment in which decisions are made.
Personal Attributes
1 . Knowledge of information systems
If managers are aware of what computer-based systems can do, their information requests will probably be more sophisticated and more specific. Their knowledge of capabilities and costs places them in a much better position to aid in the design of a good system.
2. Managerial Style
A manager's technical background, leadership style, and decision-making ability all affect the kind and amount of information required. Some prefer a greater amount; Others like to decide with a minimum of detail and prefer personal consulatation with subordiantes.
3. Manager's perception of information needs
" You tell me what I need to know" and "get me all the facts" represent two opposite perceptions of information needs. This dichotomy is due partly to the fact that many managers are ignorant of what information they need. Another dimension of the problem is the widely differing views of the managers regarding their obligation to disseminate information to subordinates and to groups outside the firm. Teh manager wh ocannot or will not delegate authority is likely to keep information closely held.
Organisational environment
1. Nature of the company
Problems in communication and in controlling operations seem to be a function of the comapny's size and the complexity of its organization. The larger more complex firms require more formal information systems, and the information needs of these systems become more critical to operations.
2. Level of Management
There are three levels of management (i.e strategic planning, management control, operation control) and the varying needs for information at each. Each level needs different type of information, generally in different form. top levels need the one-time report, the summary, the single inquiry. The management control level needs the exception report the summary and the variety of periodic reports for regular evaluation. The operational control level requires teh formal report with fixed procedures, the day-to-day report of transactions, to maintain operational control of actions as they occur. Managers at all levels have changing information needs, depending on the nature and importance of the particular decision.
3. Structure of the organisation
The more highly structured the organization, the easier it is to determine the information needs. Where authority and responsisbility are clearly speelled out, relationships understood, and decision-making areas defined, the information needs of managers can be determined more easily.
(Above section adapted from Information systems for modern management
by Murdick, Ross and Claggett)
4.4 Stages In Process Design:
The Process of information systems development in its first phase attempts to determine the scope and type of system the user wants. The next phase analyzes the above requirement in two parts to facilitate detailed verification and validation before the system is actually designed and implemented.
Requirements Determination
This stage consists of obtaining user needs and requirements which reflect the user-expectations from the IS being developed. It consists of several stages:
1) Problem definition
2) Feasibility Study
3) Requirements Acquisition
4) Requirements Analysis
The problem definition and feasibility study stages consist of definition of a bare outline of the desired system. The Problem Definition Stage defines to a high level of detail the application for the desired IS and an indication of the advantages that will result from its implementation. The Feasibility Stage is the examination of the different alternatives with which a solution can be found for the design of the desired system. The Requirements Acquisition Stage results in a "statement of requirements". The Requirements Analysis stage produces the "requirements specification". Using the 'statement of requirements' as the main input the aim of the requirements specification is to act as an overview of the desired system in a structured form.
Analysis Phase
This phase analyzes the requirements from the previous phase and converts them into components, which are used to build a 'specification' of the desired system. The specification is more precise than in the previous phase and adds more detail, at the same time retaining user semantics, so that the description would be recognizable to the user. However the model is at an abstract level, that is, with no details concerning data representation or computer implementation.
Logical design
This phase produces a design of the desired system that will serve as a basis for computer implementation. There are two major tasks in logic design. Firstly the specification from the analysis phase is transferred and secondly the human computer system is designed. The significant difference in this phase is that the structure component is now represented by data. There will often be several possible ways of representing relationships. We may also use normalization in this phase. We decide exactly what data types are required for data representation, how many characters are required for each data item and we design records and files or databases to store the data, taking into account the type of processes that will operate the data. An abstract programming form is often used here, such as structured English, JSP diagrams or action diagrams. In addition DFDs may be drawn showing the processes that occur, the data input to and output from each process etc.
The second major task in logical design consists of design of human computer systems. Two levels of detail are normally considered here:
- Design of user procedures which consist of tasks and processes with which users will be directly involved
-Computer interface design consist of the detail of processes and the objects on which these processes operate, and may involve considerations related related to interaction style ( screen and report layouts, human-computer dialogues), specifications of manual or mechanical operations, and off-line or online processing.
Physical design
This is the last of the design phases. We may consider it as consisting of 3 components: Hardware, software and human-computer systems. The hardware design consists of a description of the computers, storage devices, input/output devices and possibly networking devices required for the desired system.
Software consists of the programs that run on the hardware. The physical design of data needs to be considered as the kind of data invariably affects the programs that process the data. It will be necessary to decide on the appropriate types of applications software, including languages and packages as well as systems software required for supporting the eventual system.
Process Design
There are four options for process design
1. For standard processes, we can buy packaged software. For example,
accounting software is largely standardized.
2. Use of a fourth-generation language such as lotus123, VB, Oracle
etc.
3. Generate code using a CASE tool
4. Write our own code.
If in-house coding is done data structures are chosen for the representation of data in the programs, together with decisions as to the programming language required for eg. COBOL, C++ etc. Issues such as execution speed and ease of maintainability of program code are considered.
Human Computer system design
Some of the design of this system specifies the activities to be followed when communicating with the computer, for example, detail of dialogue between computer and operator, procedures for starting-up and shutting down the system and screen contents such as windows or colors etc.
Implementation And Testing
The major output of the implementation and testing phase is a physical information system and not a design. Of course the physical and earlier designs remain available for reference, as they form the specification. The major tasks consist of:
The maintenance phase consists of correcting errors in the system or responding to changes in the user requirement, due, for example, to environmental changes or personal preferences for system operation and it may require reworking of all the previous phases for the part of the system that requires changing.
CHAPTER 5
INFORMATION SYSTEMS MODELLING (TM)
5.1 System Design
The basic information model consists of three parts as shown below and the data dictionary. The external models represent the user views of the system. These are brought together into a single global conceptual model as illustrated below. The conceptual model does not take into consideration how the data and processes will be implemented on the computer. This is accomplished through the internal model (shown as 'schemas' and 'programs' in the diagram below)
5.2 Stages in IS modeling
As mentioned earlier, we do not design the internal model right away. A conceptual information model is first formulated and this is then translated into an internal model. Also we need to develop two conceptual models
(a) A conceptual data model and
(b) A conceptual process model.
These are then checked for consistency and, any necessary modifications are made to arrive at the data processing model. This is the first level information model. (the data model, the process model and the data processing model) otherwise called first level design.
Second level design is concerned with adapting the first level design to the specific requirements of the processing required. It may be that the first level design consists of so many relations that it would not achieve an acceptable level of performance if it were implemented in that form. Hence the model may need 'flexing' to accommodate the demands of the functions which the information system may support. The result of this is the second level design information model.
The final stage is the third level design where the model is mapped into the internal schemas required by the software being used to implement the system.
The process of moving form first to second to third level design may seem rather long but it is important for a number of reasons. The first level will provide a transaction-independent view of the information content of the system. However it will still be enterprise-dependent because the data model will only reflect the things of interest to that enterprise. The second level design is enterprise or transaction dependent, but is still independent of hardware and software. Hence the second level can be used to evaluate alternative implementations and assist in the selection of hardware and software. Third level design is enterprise, transaction and software dependent.
The process of design is shown in the diagram below. IT is important to note that this process does not equate the design of the entire information system. In particular it does not cover data on establishing the feasibility of an IS, nor on strategic decisions involved in selecting an information area. Similarly nothing is said about the design of forms, codes, screens and reports nor of the techniques for the analysis of the requirements of the users.
CHAPTER 6
METHODOLOGIES FOR IS DEVELOPMENT
6.1 System Development Methods (MR)
( Source : Yourdon system methods, model driven methods, 1993)
The evolution of system development methods has been gradual. The three stages in the evolution of system development methods may be identified as :
1) First generation methods.
2) Second generation methods.
3) Third generation methods.
First Generation Methods
These methods includes various "structured techniques" developed during
late 1960s and
1970s. Structured techniques breakdown a complex problems into smaller
components with
well defined inter-relationships between components. " DIVIDE and RULE
"
Components of First generation methods:
1) Structured programming.
2) Modular design and structure charts.
3) Programming style.
Modular design : many programming languages allow groups
of statements to be reused, such a group
of statements are called program module and their use is referred as
modular programming. structure charts
show how modules are connected to form a program.
Programming style: using standard constructs, code can be complex and difficult to understand and it was also understood that maintainable code also required style guidelines ( 1970s).
Data Structures: data design tech. used in 1970s were pragmatic ways of building data structures and files to support programs. CODASYL organization was upfront in database design in late 60s.
Structured Design: structured programming technique only addresses "design in small" , these never gave any guidelines on how to carry out "design in the large".
Successive refinement (Top Down Functional Design): A required system function was broken-down to smaller number of tasks that could be combine to accomplish the function. Each of these were in turn broken down into smaller sub-tasks. The process was continued until the subtask was so simple that it could be coded with little chance of error.
Techniques based on the semantics of the structure chart
Main criteria for improving program design were based upon :
Structured Analysis: The set of tools and techniques referred to as " structured analysis " were developed to address the problem of identifying and stating the user requirement in an unambiguous, understandable form. These techniques were mainly "Process-oriented" concentrating on required system functions.
Modeling tools : The main need was for modeling tools
that would help to partition complex requirements into smaller units with
well defined inter-relationships. The modeling tools used were :
1) Data Flow Diagrams to show the portioning of proposed system into
smaller functional areas or "mini-systems".
2) Mini-specs to specify each "mini-system".
The use of review sessions, where part of the requirements was also presented was a key technique capturing user requirements. These review sessions were termed as "structure walkthroughs".
Information Modeling: at the same time as structure analysis were developed, a semantic approach to information modeling was formulated. This was based on real-world entities and relationships.
Problems with top down functional decomposition (TDFD) :
Top down functional decomposition was carried out by trying to guess what main functional area were. Each functional area was then examined in turn and successively broken down until the functions were simple enough to verify with the user.This lead to second problem that caused TDFD to be supplemented or replaced in the second generation methods.
Analysis-Paralysis
Correct partitioning of the system could not be done until system was understood and system couldnt be understood until it had been partitioned. Because of this problem an optimal statement and organization of the user requirement was very time consuming, required considerable reworking of the models and due to time pressure it compromise on quality of work.
Analyst Bias
TDFD is creative technique and reflects the way the analyst thinks or perceives the system. The logical model tends to reflect the unconscious bias of analyst towards a specific solution.
Fragmentation of Policy
Although there were guidelines that helped identify the best organization of the user requirements,it was sometimes found that functions which were widely separated in the model needed to be cross-checked.
Different system development philosophies:
1) Process and data driven methods.
2) Phase oriented and model oriented development.
Process oriented: concentrating on system functions and regarding the data as only being present to support system functions.
Data Driven methods: Concentrating on information requirements, particularly in terms of identifying the data to be stored in database. Systems functions were considered to be less important.
Phase oriented : System development life cycle was seen as sequence of phase, each consisting of well defined activities that had to be carried out.
Model oriented : here life cycle was seen as a sequence of models of system requirements. Each model had a defined structure that could be checked.
Second Generation Methods
Analysis techniques are based on real world requirements of two types
a) response to real world events and
b) store information about real world entities.
Real World Events : Time is more explicitly modeled in terms of events that occur in the environment of system.System behaves as they do only because of these events that occur and requires policy for responding to these events.
Real World Entities : By collecting information about real world entities and the relationships between them, the analyst avoids bias towards any possible data storage organization.
CASE (Computer Aided Software Engineering )
Use of CASE was not common until 1980s although such tools become available from about 1975.Some case products have "draw what u want "approach and some have "more well defined grammar that the diagrams can be checked against".
The second generation technique are mainly " Diagram Oriented" unit of modeling is a diagram. Diagrams are drawn and checked.
Reasons For Third Generation Methods
The second generation view of models is rather low-level.It deals with individual diagrams rather than the larger issues of how individual analysis and design unit fit together and interact.
Third generation methods will be distinguished by a philosophy that is more concerned with the whole rather than parts.
6.2 Techniques (TM)
An information systems development methodology can be defined as a collection of procedures, techniques, tools and documentation aids that will help the systems developers in their efforts to implement a new information system. A methodology will consist of phases, themselves consisting of sub-phases, which will guide the systems developers in their choice of techniques that might be appropriate at each stage of the project and also help them plan, manage, control and evaluate IS projects.
Definition of terms:
Methodology: As defined above it basically represents a way to develop IS systematically. Techniques: May involve the use of one or more tools which represent some of the artifacts used in information systems development.
Tools : Tools are usually automated, that is, computer tools normally software to help the development of an IS.
Techniques may be used in common among several methodologies. However they are not interchangeable because when used in a particular methodology they could address different parts of the development process, be used for different purposes or be applicable to different objects. Listed below are the techniques used in the information systems development process:
1. Rich pictures
2. Root Definitions
3. Conceptual models
4. Entity modeling
5. Normalization
6. Data flow diagramming
7. Decision trees
8. Decision tables
9. Structured English
10. Action diagrams
11. Entity life cycle
12. Object orientation
13. Structure diagrams
14. Matrices
The above table shows the position or stage in the development where any particular technique is utilized and whether it is primarily regarded as general, or data or process-oriented.
The asterisk indicates the IS development stage or stages (discussed previously) in which the technique is most commonly used. For example entity modeling is used in two stages but its use at the logical design stage is most common.
6.3 Tools (TM)
Tools (especially automated tools) are available in plenty for the system development process. Listed below are a few tools classified (and thereby defined) into some significant groupings.
1. Project management tools
2. Database management systems
3. Data dictionary systems
4. Systems repositories
5. Drawing tools
6. CASE (computer aided software engineering) tools
Methodologies for information systems development make use of some of the process-oriented techniques of functional decomposition such as data flow diagrams, decision trees, decision tables and structured English. Functional decomposition gives structure to the processes reflected in particular by the most important technique of data flow diagrams. This emphasis on structure gives the name of the first methodology STRADIS.
Some of the several methodologies proposed for IS development include:
SYSTEM DESIGN AND MODELLING (MR)CHAPTER 7
7.1 Business Process Redesign
(Ref: Engineering management review (Vol 26 ,number 3, fall)
Business Process Redesign is defined as "the critical analysis and radical redesign of existing business processes to achieve breakthrough improvements in performance measures."
In 90's 2 tools revolutionised the organisations these were :
1) Information Technology
2) BPR ( Business Process Redesign )
IT : This includes the capabilities offered by computers, software and telecom. IT is considered as analysis and modeling tool. Thinking about IT should be in terms of " How it supports new or redesigned business processes.
Use of IT in Manufacturing Industries :
a) Process Modeling.
b) Production Scheduling and Controls.
c) Materials and Management Information Systems.
d) Logistics.
Business Process ( BP ) : Business processes are defined as set of logically related tasks performed to achieve a defined business outcome.Set of business processess forms a business system.
Business processes have two important characteristics :
a) They have Customers : Recipients of outcome.
b) They cross Organizational Boundaries.
Five steps in (PD) Process design :
1) Develop Business Vision and Process Objectives : Prioritize objectives
and setstretch targets.
2) Identify the Process to be Redesign : To find out critical processes.
3) Understand and measure existing process : Identify current problems.
4) Identify IT levers : To think of new process approach.
5) Design and build a prototype of the process : Implementation.
Develop Business Vision and Process Objectives.
In past process redesign was to rationalize the process, i.e to eliminate obvious
bottlenecks and inefficiencies.
Most likely Objectives :
Identify the processes to be redesigned.
High Impact approach : Attempts to identify only most
important processes
This is required because :
a) Problems must be understood so that they are not repeated.
b) It can act as a baseline for future improvements.
Identify IT Levers.
Role of IT in process design should be considered in early stages of redesign. All of IT capabilities involve improving coordination and information access across organizational units, thereby allowing more effective management of task interdependence.
Design and Build a prototype of the process.
The process design after agreements by owners and stakeholders are implemented
on pilot basis ( Parallel with the existing processess) examined regularly
for problems and as the process reaches final acceptance, it is phased
into full implementation.
Three major dimensions can be used to define processess,
1) Organisational entities or subunits involved in the process.
2) Type of objects manipulated.
3) Type of activities taking place.
Defining Process entities :
Inter-functional Processes : Achieve major operational objective such as new product realization, asset management, production scheduling.
Interpersonal Processes: These are the processes within and across small
groups. Using " electronic mail and conferencing."
a) Physical
Capabilities of Information Technology for reshaping management issues
includes :
a) improve analytical accuracy
b) enable broader management participation
c) can generate feedbacks
d) can streamline the time and resources a specific process consumes.
To attain SCM integration, it is necessary to understand the infromation
requirements of all the participants and design system that facilitate
co-operation.
Why BPR Project fails ?
1) Lack of sustained management commitment and leadership.
2) Unrealistic scopes and expectations.
3) Resistance to change.
4) Narrow technical approach.
5) Cost-Cutting focus.
What can be done to make a BPR a Success ?
1) Do something smaller first ( Pilot Experiments ).
2) Conduct personal transformation ( change of mindset ).
3) Get IS and HR involved.
4) Empowered and collaborative workers support.
5) Realistic expectations.
6) Prioritise the objectives.
SUCESS OF BPR DEPENDS ON THE PEOPLE WHO DO IT AND HOW WELL MOTIVATED ARE THEY.
7.2 System Modeling
(Source : Yourdon system methods, model driven methods, 1993 )
Modeling Tools
Uses of Modelling Tools :
1) Focus on important system features.
2) Medium of communication with users.
3)Document the systems analyst's understanding for the impementation
for implementation by designers and programmers.
Graphic Tools : These are used to show high level components of particular aspect of a model. Each graphic modeling tools has set of icons used to represent specific model component. Graphic tools are preferred type of modeling tools when the connection between model components is important.
Graphic tools in essential modeling are mainly of a semantic nature highlighting the meaning of the requirements.
Graphic tools in implementation modeling are mainly concerned with syntax or structure.
Tabular Tools : Some information is usefully laid out in tabular forms. Tabular tools may be useful in some circumstances particularly if subject matter expert finds the graphic modeling tool difficult to relate to.
Frames : Frame is used informally for a certain type of specification tool. Frame specifications are used to specify all relevant info about a model component that has been declared on a diagram or another frame.
Textual Tools : Textual grammar is defined formally, using meta language or set theory.
7.2a Entity Relationship Diagram (ERD) :
ERD is semantic modeling tool used to identify and organize information and to model particular roles of importance to the enterprise and relationships between them. This may also be used as a tool for discovery of rules and events. These are not contingent on the modelers point of view or interpretation as these are real world facts. Enterprise Essential Model uses ERD to define entities it uses and the relationships between them. System essential modes uses ERD to show the entities and relationships that the system has responsibility for collecting or using information about.
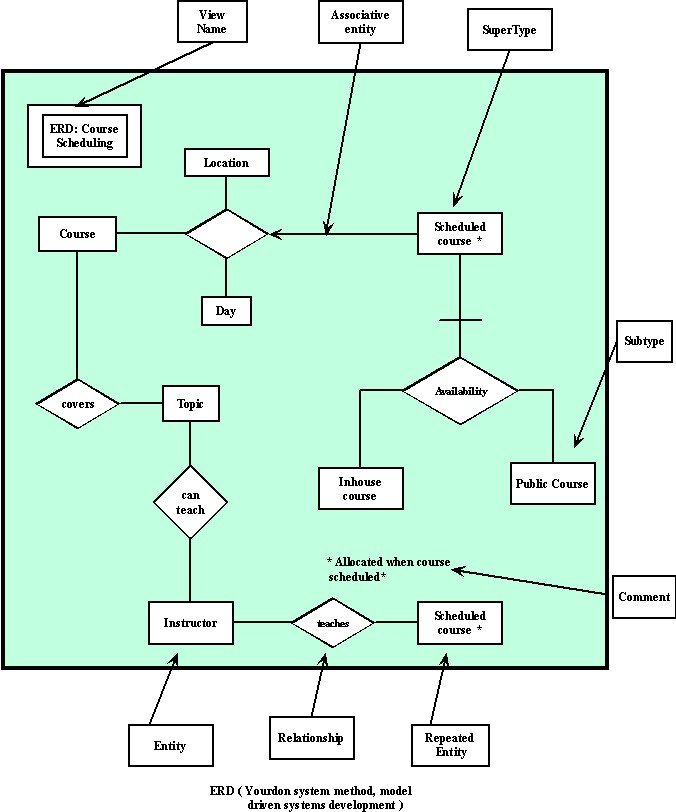
Components of ERD :
Entity : Entity is a class of real world thing whose role of interaction with the enterprise is well-defined. Each entity has a unique name which should reflect the role that is played by that type of object. These things may be physical objects abstract concepts. Each entity must be distinct from but fulfill the same role as other occurrence of the entity. Instructor in ERD defines entity.
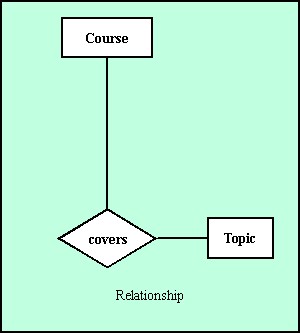
Relationship : relationship represent possible associations that may occur between occurrence of entities. On diagram, each relationship is shown linked by lines to entities to which it refers. "Occurrence of the relationship" represents a single instance of the association between entities.
Relationship Frame : Each relationship frame that includes the entities involved and other text forming a complete sentence.
![]()
source : Yourdon system methods, model driven methods, 1993.
Each occurrence of relationship corresponds to a specific occurrence of a "Course" and a specific occurrence of "Topic".
Binary Relationship : A relationship that refers to two entity occurrences is called binary relationship.
Higher order Relationship : A relationship involving more than 2 entity occurrences is referred to as higher order relationship.
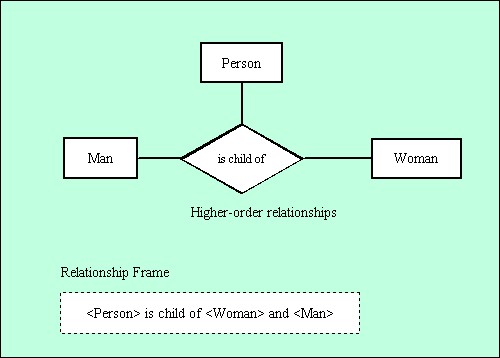
source : Yourdon system methods, model driven methods, 1993.
When entity is repeated in relationship,the relationship is referred to as being recursive. For recursive relationships, the role for the entities must distinguished as it can be seen in the frame that employee reports to other employee who is manager.
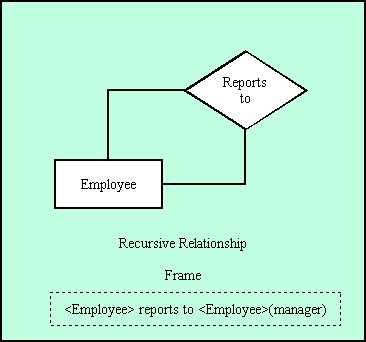
source : Yourdon system methods, model driven methods, 1993.
If the occurrence of entities in a recursive frame is not significant the relationship is known as symmetric. The relationship " is friend of" is an example of symmetric relationship. For symmetric relationships , the role for the entities doesnt have to be distinguished.
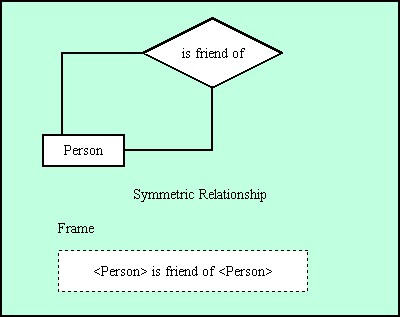
source : Yourdon system methods, model driven methods, 1993.
Associative Entity : This is the entity which acts as entity and relationship both. As a relationship it indicates a group of real world associations between entities. Attributes of associative entity do not describe the entities that participate in relationship but the occurrence of relationship between them.
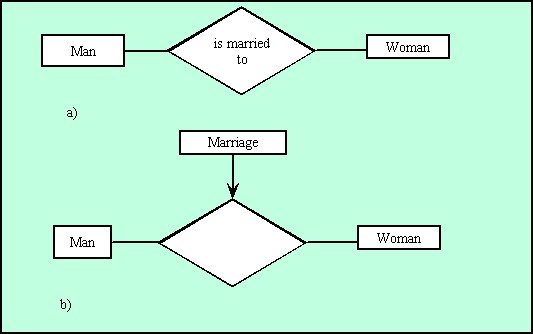
source : Yourdon system methods, model driven methods, 1993.
a -describes a relationship.
b -date on which marriage took place is neither an attribute of "man"
nor "woman" but it describe the occurrence of relationship.
marriage -associative entity
date-as an attribute.
Each occurrence of "marriage" records the fact that specific man was married to a specific woman on a specific date.
Subtype, Subtyping and Supertyping :
Subtype : Subtype of entity is a well defined group of occurrences of entity that may be regarded as entity in its own right.
Subtyping indicates that the enterprise regards the entity as being made up of number of distinct identifiable groups each of which is referred to as a subtype.
Supertype : supertype is regarded as a general grouping of several entities.
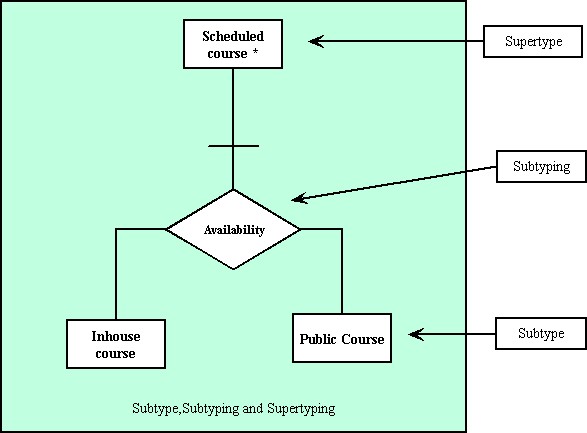
source : Yourdon system methods, model driven methods, 1993.
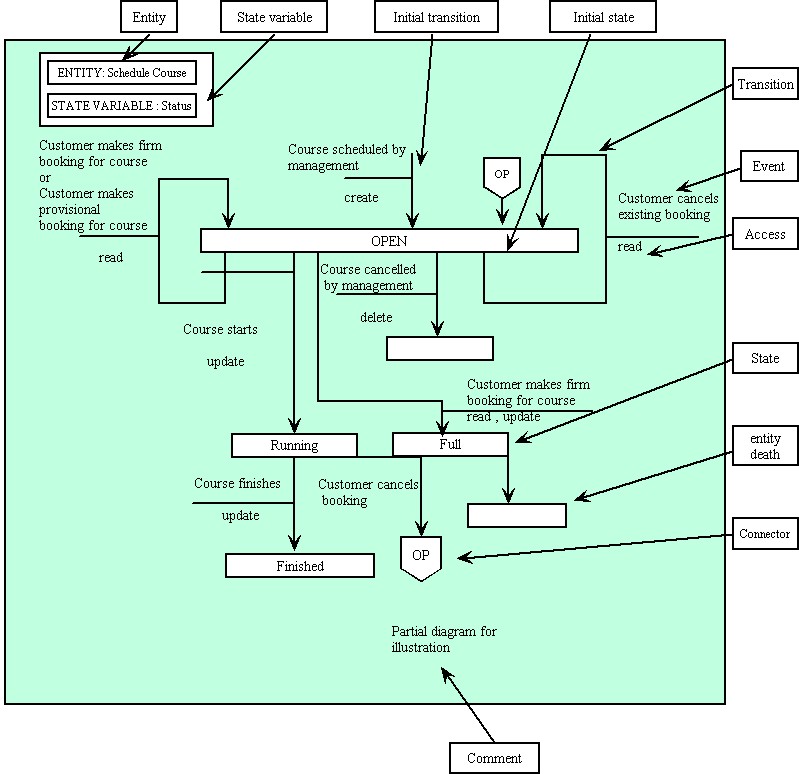
7.2b State Transition Diagram ( STD )
STD models time dependent behavior.In STD, each state represents a period of time during which the system exhibits some observable behavior.
source : Yourdon system methods, model driven methods, 1993.
Components of STDs
Access : Access on STD shows the possible access to the occurrence of entity when change of state occurs.
Create Access : causes a new occurrence of entity to exist , occurs for initial transition.
Read Access : for an event which occurs and requires some attributes to be used but not necessarily changed.
Update Access : used where some of attributes of entity are to be changed.
Delete Access : after this entity do not exists.
Match Access : to check whether a specific occurrence of the entity exists.
Connector : Where it is difficult to draw diagrams without crossing transaction lines a pair of connector symbols may be used. On diagram connector "op"is used in this way.
Entity : each STD is for one state variable of specific entity.Example shown is for associative entity "scheduled course". An entity may have several STD one for each of its state variable.
Entity death : this indicates that occurrence of entity no longer exists and cannot be accessed.
Event : event is the thing which causes transition to take place.When this event occurs a change of state may occur for one occurrence of the entity but it doesn't always occur.The responsibility whether or not it does occur resides in a data process.
Initial State : state of the occurrence of entity when it is created.A transition to this initial state is referred to as an initial transition and must always include "create".
State : Each occurrence of the entity have a well defined state for a given state variable. Each schedule course may have a status of "open","running", "full" or finished".
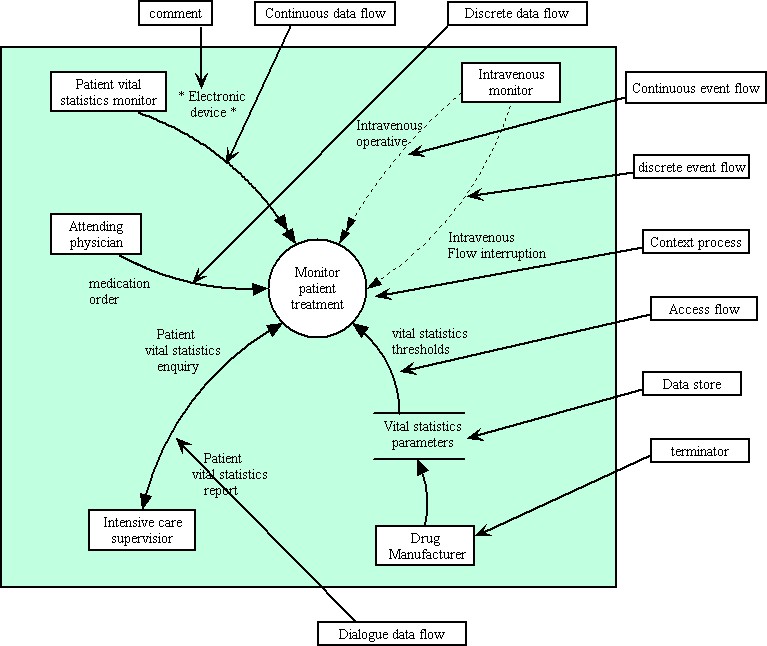
7.2c CONTEXT DIAGRAMS
This is a diagram where systems is represented as a system diagram in whole.Purpose of context diagram is to depict how the system is connected to,interacts with other entities which makes its ( data ) environment.
source : Yourdon system methods, model driven methods, 1993.
Context diagram show all external entities which interact with the system and all data flows between these and the system.
Components of Context Diagrams:
Access Flow : access flow indicates that the system uses stored data which is shared between it and its environment.
Continuous access flow : if system or a terminator continually updates or monitors the value in a store it is shown as continuous access flow.
Discrete access flow : Access toa store that takes place at a particular instant of time. Data is present in store and can be accessed anytime.
Context Process : This is a process group which represent the system.On context diagram system is regarded as a "Black Box". All requirements for behavior or data storage by the system is considered to be within this process.
Dataflow : data flow on context diagram either represents information produced within or outside the system which is used by outside world or by the system itself.
Continuous data flow : continuous data flow represents a value that is available over a period of time.
Discrete data flow : data flow that is only present for a instant of a time.
Dialogue data flow : a data flow generated by the terminator for the use of system is combined with a data flow created by the system for use of terminator.
Event Flow : indicates synchronization between the system and its environment.
Continuous event flow : represents a status that is indicated over a period of time.
Discrete event flow : event flow that is only present for an instant of time.
Dialogue event flow : pair of event flows that occur at the same time may be combined and shown as a dialogue event flow , provided that they are to/from the same terminator. Dialogue event flow is used to show a group of input flows ,together with corresponding response flows either initiated by terminator or the system.
Terminator : terminator is a producer or user of data that interfaces with the system.
Data Store : a data store on the context diagram shows an interfaces between system and its environment. The store indicates that the system and terminator are decoupled in the sense that one can change values in the store independently of the other.
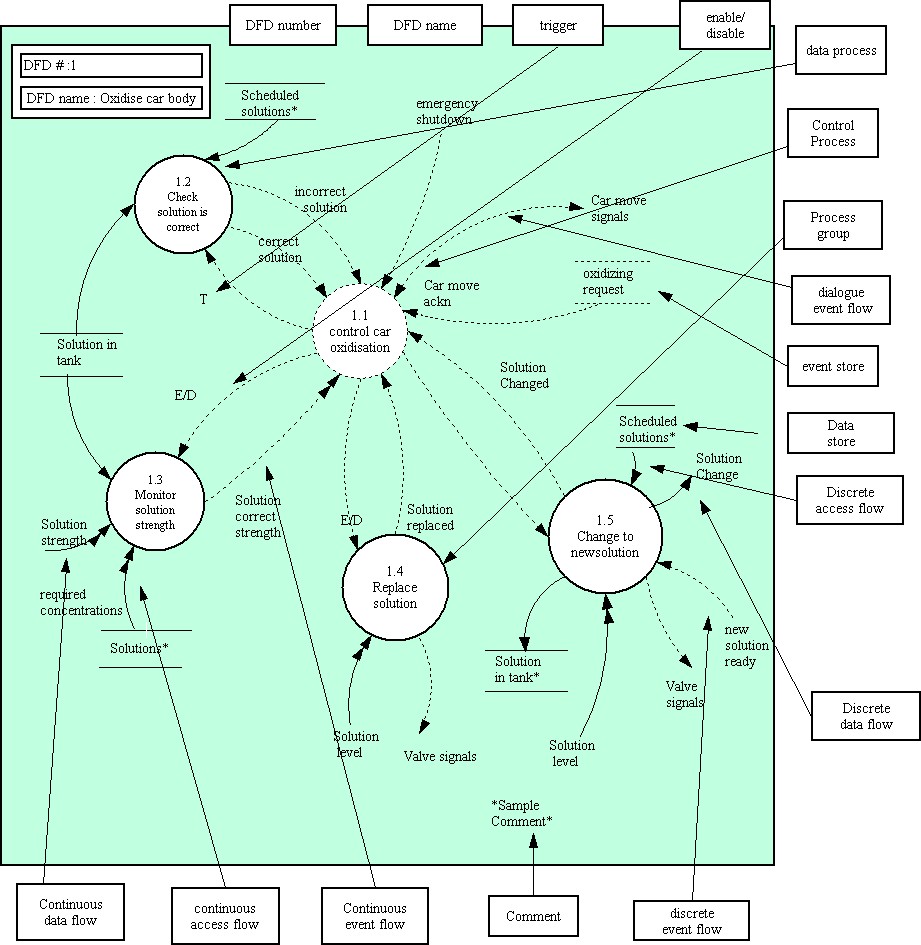
7.2d DATA FLOW DIAGRAMS (DFD) :
A data flow diagram is the most important technique for modeling high level detail of the process within a system.These highlights the functions of the system and how they use stored information and transfer information between each other.
source : Yourdon system methods, model driven methods, 1993.
They show how input data is transformed to outputs results through sequence of functional transformations.
Components of DFDs :
Access Flow : access flow is used to show that a process needs to use or change stored information to accomplish its purpose.An access flow from a store show that the process uses information held in the store . This may correspond to:-
a) Create access : to create a new occurrence of an entity or relationship.
b) Delete access : to delete one ( or more) occurrence of an entity or relationship.
c) Update access : to modify the value of an attribute.
d) Change access : to change the state of a state variable.
Continuous Access Flow : In some situations it is necessary to continuously monitor the value in the store. This is carried out using data process. Link between this data process and the store is shown as continuous access flow.
Control Process : Control process coordinate the activation of processes and signal to other components of system essential model. The coordination is carried out by interpreting and generating event flows and controlling processes by triggering or enabling or disabling them.
In figure control process "control car oxidation" shows that control logic must be present to coordinate the monitoring, changing and replacing of solutions.It also derives the movement of the car body by interpreting the state of the oxidation bath and generating required signals such as "move car signal" to move the car body.
Continuous event flow : continuous event flow is one that is available over a period of time, such as the status of a device. Continuous event flows represent a situation or status that is either true or not.
Data Flow : a data flow represents the information generated by a source and used by another system function or terminator. On a data flow diagram the source of the data flow may be :
Continuous Data Flow : Data Flow that persists over a period of time is called as continuous data flow.The value is present over a period of time and may change during that time.
The figure shows a continuous data flow "solution strength" used by the process "monitor solution strength". Solution strength is the present strength of solution which is continuously present.
Dialogue data flow : dialogue data flow contains several data flows as an interface.At lowest level there can be two data flows in direct relation to each other, one causes the other to occur.
Comment : free-format comments may be added to the DFD to elucidate or stress any important points. Comments may be used to highlight any aliases,ties to previous or anticipated implementation.
Data flow diagram name ( DFD Name ) A data flow diagram has the same name as the corresponding process group show on the parent DFD.The context diagram is treated as a DFD with one process group.
Data flow diagram number ( DFD Number ) A data flow diagram has the same number as the process group it describes in more detail. The child diagram of the context diagram is numbered "0".
Data Process : A data process is a process that solely transforms data.Data processes may be continuous or descrete.A continuous data process may generate continuous or discrete event flows.A discrete data process cannot generate continuous event flows.
Data Store : Stores act as buffers between processes that are active at different times. A data store holds the data at rest.
A data store between two processes 'decouples' them ; a data flow between them 'synchronizes' them. In the figure the data store " solutions" is a collection of entity occurrence of all possible solutions used in the bathing of car bodies.
Dialogue event flow : Dialogue event flow is a packing of several event flows between two processes or between a process and a terminator.
Discrete access flow : A discrete access flow is an access to a store that takes place under the control of the system at a particular instant of time.In figure the process "Check solution is correct " accesses the store "solution in tank" to insure that the solution is correct for the car that is about to be bathed.
Discrete data flow : data flow that is variable for an instant of time is discrete data flow. A discrete data flow is transient and must be processed at the moment it occurs.
In the figure "solution change", generated by "change to new solution" represents the need to tell the operators that they must change to a certain solution.This is an example of discrete data flow.
Discrete event flow : event flow available for an instant of time is called as discrete event flow. If a control process detecting the discrete flow is not active at the time it occurs, the event flow will be lost.
Enable / Disable : This represents a process being enabled and disabled from a control process. An "E/D" represents the fact that the control process enables the process at one time and disables it subsequently.A process that is enabled will run whenever its stimulus occurs or run continuously until disabled.
Event Flow : An event flow represents the occurrence of an event ( discrete ) , or the state of something ( Continuous ).
Event store : An event store is a mechanism for storing events relating to resources until they can be used by a control process.When an event detector signals an event store ( rather than use a discrete event flow), it can respond ,or until the store is reinitialized.
Process : A process is a system function.It is either a data process , a control process , or a process group.It may be either continuous or discrete.
Process group : A process group represents a group of processes as a single icon on the diagram. This group may also contains internal stores and flows to accomplish its purpose -these are 'hidden' within the process group.
Process group are used to reduce the complexity of any one data flow diagram by combining related functions and naming the combinations for the general function that this group carries out.
In the figure "change to new solution" is a process group comprising processes "control solution change","determine new solution","detect empty tank", etc.
A process group is drawn on the diagram as a solid circle, it cannot be visually distinguished from a data process without looking at its specification.
Trigger : A prompt labeled "T" represents a trigger . The trigger will activate a discrete process , which will then "run to completion' and 'stop'.
In figure "check solution is correct " is triggered , as it will run in "zero time" and immediately reply with one of the two event flows "correct solution" or "incorrect solution".
Strengths and Weaknesses of DFDs
Strengths : DFD method is an object oriented method that allows to design systems using objects. It is widely used and promotes easy architecture and coding of a project. This method is also easy to learn.The symbols are few and simple and easy to translate.
Weaknesses : There aren't many weaknesses associated with this method. The DFD for large programs can be hard to translate and take a lot of time. Also, once the DFD is drawn for such a program, it becomes difficult to read and understand what is going on. The data flow can become confusing to the programmer in such an instance. Also, if the DFD is not drawn with the great amount of detail, then it is not useful to the programmer. Another disadvantage of using the DFD model is that the symbols used are not common to all DFDs. Different models use different symbols for the structure of a DFD.
7.2e DATA DICTIONARY
(ref :1. E. Yourdon (1989) : Modern Structured Analysis, Prentice-Hall , 2. T. De Marco (1991) : Introduction to System Analysis and Design. IInd edition, Prentice-Hall )
During the analysis and design of a system, huge amount of data is collected. If data is going to be referenced throughout the design, and several people are responsible for that design notation, then individuals who may not have initialized that data but will need to reference it need to know where it came from. Manually thumbing through several volumes of the data is not the most efficient way to find such information. To make sure that everyone can access it, it needs to be stored centrally in one document. A Data Dictionary fulfills that role.
Dictionary is basically a way of organizing the information, which is collected. This information enables us to work out the composition of the data, uniqueness and consistency of names and definitions of terms, and document them in dictionary which all team members can use. Ultimately it contain all information that enters, leaves and is transformed by the system, the policies surrounding that information, and description of all other objects and events of interest. This includes:
2 good ways for proper management are :
Notation helps to denote the basic kind of relationships between/among
data items and elements, plus other information. These are some examples
of data dictionary notation.
| NAME | SYMBOL | MEANING |
| Compostion | = | is composed of |
| Concatenation | + | and |
| Iteration | { } | multiple occuerneces of |
| Selection | [ | ] | choice1 or choice2 |
| Option | ( ) | may or may not be present |
| Discrete value | " " | the value of this variable |
| Comment | * * | additional information |
Ex:
1) entity 1 entity A = element B + element C +
( element D )
here it is shown that an entity A is made up of element B and element
C and may or maynot contain element D.
2)
entity 1 travel claim = approval form + 2{ expense receipts }
it shows that travel claim contains 2 elements, approval form and set
of expense receipts.
entity 2 expense receipts = travel receipt + {(incidental expendature)}
expense receipts consists of travel receipt and additionaly it could
also consist of number of incidental expendature.
entity 3 travel receipt = [coach receipt | air receipt | rail receipt
]
* receipts not needed for a car travel *
travel receipt is needed for any form of travel undertaken with one
exception that receipt is not needed if journey is
done by car.
entity 4 approval form = name + ref. no. + claim total
approval form has three parts, name of the person making the claim,
the reference under which claim is made up and total being claimed.
entity 5 ref. no. = "B123"
reference number has a discrete value, the claim needs to be referenced
as "B123".
entity 6 name = 2 {character }
a name must be 2 character long
entity 7 claim = 1{number}+"."+2{number}2
Claim figure must be made up of 1 or more numbers, a decimal point,
and another 2 numbers to indicate fractions.
Problems with building and maintaining Data Dictionary
Imposters: items having the same name but multiple/different definitions. Giving a different (logical)name or new name can solve this problem.
Hybrid data: when definition has a hidden or mixed use. Using meaningful names and do the things right away without thinking of changing in future can avoid this very crucial problem.
Orphaned data: when nobody owns data, and nobody knows who created them. Author, data of entry and other "pedigree" information should be recorded.
CHAPTER 9
IS APPLICATION MODELS IN INDUSTRY (TM)
An increase in company size results in an increase in information collection,
processing and distribution. Hence it becomes necessary to handle many
customer accounts and production records with many more interrelationships.
In addition to increased information records, information needs and associated
difficulties there arises the problem of delegation of authority and responsibilities.
Basic Information System
The basic functions of the company such as production, sales, finance and management functions will not change.
However the introduction of an MIS will facilitate fantastic improvement in the information communications network. The objective of developing or improving a management information system can be stated as below:
1. Accounting Control
2. Plans and budgets
3. Payroll by hourly and salaried groups
4. Inventory of materials, in-process and finished goods
5. Sales by product, salesman , customer and Area
6. Purchasing records, vendors, commitments
7. Distribution-Transportation and warehousing
8. Production by product, customer, cost, overruns and backlog
9. Engineering-new products, schedules, equipment, costs
10. R&D etc. etc.
Although the current trend is to develop IS (with computer applications) in the areas other than the traditional areas, the bulk of information systems lie in the following categories :
Over time, a typical manufacturing company has developed the major information systems shown above. These systems are not separate and distinct; they connect interact and otherwise tie the subsystems of the organization together through the medium of information.
9.1 Financial Information System
The financial system is probably the most important single management information system, in the company, and in most companies it is the oldest and the best developed. These systems basically deal with large amounts of data and involve planning in the financial sector. However the budgeting function performed is wholly futuristic. Periodically the management approves a financial plan (the master budget) that assigns responsibility for maintaining incomes, investments and costs within standard limits. These plans are the basis for periodic financial reports and these reports are used by the system for exercising control and for futuristic planning.
The major operating systems of a company along with their respective functions (Shown in figure above) merge or integrate with the Accounting and Financial Information System to facilitate financial reporting and for management information for planning and control. Moreover, the financial system has a very significant impact on other systems when one considers that the ultimate common denominator of many operating decisions is the dollar. Perhaps, Billing (Invoice Preparation) is the most widely used data processing application among financial information systems.
9.2 Production/Operation System Model
From an operating standpoint, such a system is undoubtedly the most important in a manufacturing company. It crosses all subsystem boundaries and has an effect throughout the company. The production/ Operations system is concerned with information about the physical flow of goods or the production of goods and services. It covers such activities as production planning and control, inventory control and management, purchasing, distribution and transportation.
Because the quantities of data are so large and the timing of information so essential, the production/operations system is the most adaptable to automation and yields the largest benefits in terms of immediate solution of critical and costly problems. Although other applications (eg. decision-making, total system simulation) may offer greater potential, this functional area usually offers immediate pay-offs.
9.3 Marketing Management Information System
The basic areas of the marketing function that lend themselves to improvement through information systems include:
(1) Forecasting/Sales planning
(2) Market research
(3) Advertising
(4) Operating and control information : Examples include sales reports
and distribution cost reports. A marketing systems should also take into
account of the necessity elsewhere in the organization concerning for information
concerning market sales, and other internal information that affects decisions
in other subsystems of the company.
Three types of marketing systems may be summarized as
1. Control systems
2. Planning systems and
3. Market research systems.
INPUTS OUTPUTS
Customer invoices Sales Profitability
Marketing budgets by product by product
Sales call reports product line product line
Cost reports customer class customer
Inventory reports cost center salesman
Accounts receivable region
Accounts payable salesman
Payroll (marketing)
Manufacturing costs
Annual Reports (customers, suppliers etc.)
Market Research
Analyses done by the system for periodic automated reporting :
-- Life cycle analysis
-- Marketing Personnel Analysis
-- Financial Analysis
Also OUTPUTS of the system include
-- SALES RECAP
-- RECORD SUMMARIES
-- TRANSACTION ANALYSIS
-- EXCEPTION INQUIRIES
(Adapted from : Information systems for modern management by Murdick, Ross, Claggett)
CHAPTER 10
"The face of business is changing." "Businesses that do not become an e-business will not be around in five years."After watching the Superbowl this year, one might be will to accept these statements at face value. These statements lend themselves into being the mottoes of Silicon Valley, knowing these quotes come from Andy Grove chairman on Intel and also from a recent article in the Harvard Business Review by Hamel. It should obvious that an industry representative would make claims on the future that are much more hype than reality, but when these same statements are made in prestigious business journals, how does the business world react? Information Systems are the medium of this "evolution" in business and the proliferation of technologies is the catalyst IS change. The major shift coming is the impact of the internet-platform for doing business, which is currently being done on proprietary EDI systems. It is believed by businesses on the cutting edge of technology that the internet will be a leveling field for businesses that could not afford EDI in the past. EDI also was once claimed to be an evolutionary business step, but at an average cost of 50 million dollars for the system and in many cases no return on the investment , the future of EDI looks very grim, so say some of the successful practitioners of EDI. . In a recent joint study by the Economic Research Council and Oasig concluded that between eighty and ninety percent of EDI systems do not meet original performance goals . So while EDI is in its decline, is it prudent to embrace the new technologies of e-business? Forecasts call for a growth of e-business from 43 billion in 1998 to 1.3 trillion in 2002. The world has been wrapped many times over with internet connection lines and business already make up ninety percent of internet traffic.STRATEGIES FOR IS (JMJ)
There is little doubt that the internet is here to stay and it will have an impact on business, especially in the areas of information systems. If IS were about technology alone, its future would the very bright. Yet, information systems are more about the data and the people that use them to resolve problems. The technology is only a tool and not the answer to IS. Many software companies that do IS consulting and IS teams within the company may not agree with that philosophy, but software vendors have a tendency to be inflexible with their platforms and IS departments have a history of being rouge divisions within company structure .
A strategy to look at the future of IS, really needs to examine the past, and take a sober look at how IS in its many forms have fallen short of its promises. Steve Cardell and Neil Tiffin in an article in Industrial Management compiled six rules for putting together information systems.
1. Do not re-engineer and implement systems concurrently. From there studies the success rate is less than five percent.
2. Recognize that people fix things and information technology does not. They site Henry Ford as an example, his plants were able to process steel from iron ore to finished product in three days, in which he kept a few days inventory.
3. The business, not the IS department owns the system. This keeps costs under control and implementation on track.
4. Have an effective decision making forum. Managers and department heads are already busy, incorporating a new system that changes policy can be made very difficult if they are not kept up on what changes are taking place.
5. Configure only what the business needs.
6. When given a choice, choose flexibility
In reality strategies for IS come from studying data-flow with in an organization, and clearly defining the goals for the system and the users. If consultants are hired in they need to configure the system to fit the data flow of the business. Many EDI/ERP software companies had businesses reshape their data-flow, resulting in suboptimal returns.
The new frontier
of the internet and the information technology that drives it along with
the heavy performances of high-tech industry market can be intoxicating
to businesses, especially those IS illiterate. From the UH panel discussions,
it becomes obvious EDI has work in only a few cases, there is no standard
of IS software for the internet, everyone knows they must move to the internet,
some of the companies invited to the panels do not have clear goals of
how their organization should work with IS, and not one company was a the
same level information technology; if this is the picture of the real world,
the opening statements quoted are very risky, either very naïve or
very arrogant. Quietly below the surface-hype of technology lies the ultimate
future of IS, in the areas of data flow analysis. This is the one common
thread for all the business that have succeed with any IS system no matter
the decade it occurred in.
11.1 ELECTRONIC COMMERCE (TM)CHAPTER 11E-Commerce and EDI
Electronic commerce may be defined as the
entire set of processes that support commercial activities on a network
and involve information analysis. These activities spawn product information
and display events, services, providers, consumers advertisers, support
for transactions, brokering systems for a variety of services and actions
(e.g., Finding certain products, finding cheaply priced products etc.),
security of transactions, user authentication. etc.
[Ref. N.R Adam and Y. Yesha. Electronic commerce: an Overview]
There have been several similar electronic technologies
in the past, for example Electronic data interchange (EDI) and Electronic
funds tranfer (EFT) have been around for more than 20 years now. While
many of these have electronic trading technologies have had radical effects
within their own markets and created their fair share of publicity, none
have attracted the level of hype or have been hailed as purveyors of economic
transformation to the extent that e-commerce has in recent years. [ Ref.
The Economist The Economist Electronic commerce survey :In search of the
perfect market]
For example, EDI never gained the ubiquitous acceptance that was initially
anticipated for it. High costs for initial investment, maintenance costs,
or simply lack of preference by potential users kept EDI technologies from
developing at a more rapid pace and has traditionally restricted its use
to very large corporations.
Electronic commerce has experienced an explosion due to the
convergence of these technology developments, the merging of the telecommunications
and computing industries, and the business climate. [Ref. C Beam and A
Segev The rise of Electronic commerce :Contributions from three factors]
A ubiquitous digital infrastructure that provides an efficient means for
communication and information sharing presents an extremely attractive
new medium for electronic commerce and for the first time has the potential
to deliver what the notion of EC has always implied. [D. Tapscott. The
Digital Economy: Promise and peril in the age of networked intelligence]
Electronic commerce involves issues (both technical and non technical)
that are multi- disciplinary in nature. They are complex in nature and
overlap significantly with each other. Technical research issues overlap
with other technical research areas. For example, finding and filtering
information is a fundamental requirement of an electronic commerce system
but can be an equally important service for a digital library.
The figure below depicts the multidisciplinary nature of EC. As shown
in the fig. The model is made up of several major components, beginning
with the consumer who is interested in purchasing some goods electronically
from some vendors whose product lines are represented in and are part of
a global electronic marketplace.
The objectives of E-Commerce are
several. Primarily they involve increasing the speed and efficiency of
business transactions and processes, and improving customer service. Also
EC should :
- Streamline procurement processes thereby cutting overall costs via
a more competitive process
- Contribute to a decrease in the length of production cycles.
- Enable enterprises to conduct business with distant partners the
same way they do with neighboring partners.
- Empower small businesses.
- Create new services and businesses.
- Help expand the horizon of participants.
In contrast to the emerging area of EC, EDI (Electronic data interchange)
which has been around (in the same form) for 20 years now is the cause
of positive and negative effects on industrial structures. A true cost
benefit analysis of the effects can be difficult to assess, however; the
costs become much easier to quantify than the benefits. Reduced personnel
expense for data entry, paper and postage savings, and shortened receivable
cycles are all quantifiable benefits, but the thousands to hundreds of
thousands of dollars required to set up and maintain the implementation
of traditional EDI needs to be justified with more significant benefits
than these.
For an EDI implementation to be successful, it needs to
be the direct cause of improved productivity and internal operations, create
closer customer vendor relations, provide a competitive advantage in the
marketplace, and open up the procurement process. Historically this has
not been the case for two reasons :The high cost involved with EDI, especially
for small to medium-sized enterprises(SMEs), and what we refer to as standard
issues. (Ref. Electronic commerce; Nabil Adam, Oktay Dogramaci et
al.)
E-C applications in Supply-Chain and manufacturing
Another area where EC applications facilitate improvement is supply
chain management. The objective of an electronic commerce strategy is to
provide purchasing managers with better control over their companies purchasing
habits and relationships with suppliers]
Continuous improvement of an organizations supply-chain is directly
related to its performance, and EC applications are being used in procurement
processes more and more frequently to this end. Changes in the supply chain
are closely related to inter-business retail processes. The advantages
of EC in supply-chain management include access to a wide range of suppliers
and effective use of organizational resources that are essential for implementing
just-in-time (JIT) manufacturing systems.
.[Ref. C Curtis; Getting on to the e-Commerce supply chain Just in
time Internet week Sept. 1997]
These automated systems provide new types of information for businesses
that implement them. Among the enhanced capabilities for managers are improved
sales forecasts, more accurate balance sheets, and closer relationships
with customers using a new interface. Direct communications between suppliers
and customers streamlines the supply chain and delivers new relevant information
to manufacturers in real-time.
For one example of how businesses are accomplishing these goals, craig
(in internet Week Nov. 1997) describes a joint venture between SAP and
Digital Equipment Co. to keep vending machines filled to demand with a
web-based EDI system. An embedded computer in the vending machines is connected
to the internet, and each time a product is purchased a message is sent
to the supplier. This gives suppliers crucial information about their distribution
channels in real-time, and removes the requirement for vending machine
operators to use non standard proprietary software that accomplished this
task in the past.
11.2 ELECTRONIC DATA INTERCHANGE (EDI) (MR)
(Source : EDI ebook, at editraining.com)
Electronic Data Interchange or EDI is the electronic exchange
of business documents from one companys computer to anothers computer
in nationally standard structured data formats.
Using EDI to exchange business documents eliminates the rekeying of
the data, resulting in more accurate data. In EDI, data necessary for conducting
business is transmitted directly into a system without human intervention.
We can transmit and receive EDI documents with companies such as banks,
railroads, customers and suppliers. The companies who send and receive
EDI with are referred to as trading partners.
For many years business data has been exchanged electronically on tapes, disks , diskettes and over direct computer to computer hookups. Companies realized replacing the paper used in business transactions with electronic communication saved both money and time
Customers and suppliers were interested in sending and receiving electronic documents; however, each company had different documents need and different computer and communication medium. The effort to maintain different document formats and different communications hookups became time consuming and costly. Electronic transactions started becoming standardize. Different standards for different industries still exist. The Accredited Standards Committee (ASC) X12 of the ANSI was created to support the national standards of EDI. Transaction sets (standard business transaction formats) are developed and maintained by the ASC X12.
Most of Industries use subset of the X12 standards. Following are some major industries that use subsets :
AFPA Paper Industry
CIDX Chemical Industry
WINS Warehouse Industry
VICS Retail Industry
UN/EDIFACT Standards are used internationally.
EDI Data Structure
Individual electronic transmission between trading partners is grouped in an electronic envelope similar to putting paper documents into paper envelopes. The electronic envelope specifies who is sending and who is receiving the documents. Within each electronic envelope is a collection of documents of the same type, this is called a functional group. An example of the functional group is a collection of invoices. You can group several invoices together and send them in a functional group in EDI.
Documents (purchase orders, invoices..) are referred to as transaction
sets in ANSI X 12 standards and messages in UN/EDIFACT standards.
There are hundreds of document types defined by EDI standards.
A document contains segments that are logical groups
of information. Each segment is preceded by a segment identifier and terminated
by a segment separator. A segment is made up of data elements. This is
where the information is stored.
How Does EDI Work?
EDI involves three functions within each computer system:
1) Application Interface System.
2) EDI Software
3) Communications Handler
Application Interface System
EDI Software
Communications Handler
This example shows the process of a shipment notice from the manufacturer to the customer. These are various steps involved in process:
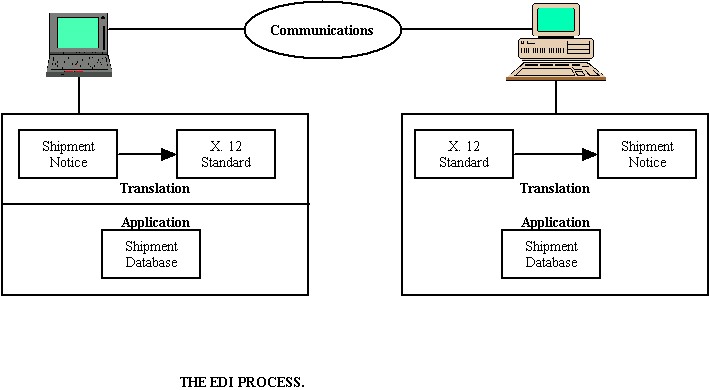
1. The data is extracted from the shipment and database.
2. The data is translated by the EDI software into a standard X12 EDI
shipment notice format.
3. The EDI shipment notice is transmitted through a Value Added Network
(VAN) to the company.
4. The company receives the EDI shipment notice.
5. The EDI shipment notice is translated into a format that can be
used to update the database of the company.
11.3 EDI and E-Commerce (MR)
(Source : Article by G.Berton Latamore, Apics,February 1999,No.2)
However, experts caution that EDI and e-commerce are not necessarily
antagonistic and agree most companies need a combination both to effectively
reach their entire supply chain.
| E-Commerce Advantages | Where EDI Excels |
| Less expensive and easier to implement for simple transactions bteween two trading partners. However becomes expensive and complex when trying to support sets of complex transactions among large groups of trading partners. | Provides a complete, integrated package to support transactions, including receipts showing that transactions were received; e-commerce only provides a template from which each form must be created and each response programmed |
| Supports near real-time transactions. | |
| Handles a much wider range of transaction types and can be used for any kind of transaction between trading partners. | Provides a complete security package; e-commerce has no built-in security and requires that a suite of separate security applications be custom integrated. |
| Supports both machine-to-machine and man-to-machine transactions; EDI only does machine-to-machine, making it an impractical answer for handling specialty or occasional orders. | VANs are very secure; the Internet, by design, is insecure. |
| Reaches everyone over the Internet; EDI only reaches trading partners who can afford connectivity to the VAN of choice. | Optimized for large volumes of transactions processed on large servers or mainframes; e-commerce is most successful in low-volume environments running on PCs or smaller servers. |
CHAPTER 12
12.1 Computer Assembly
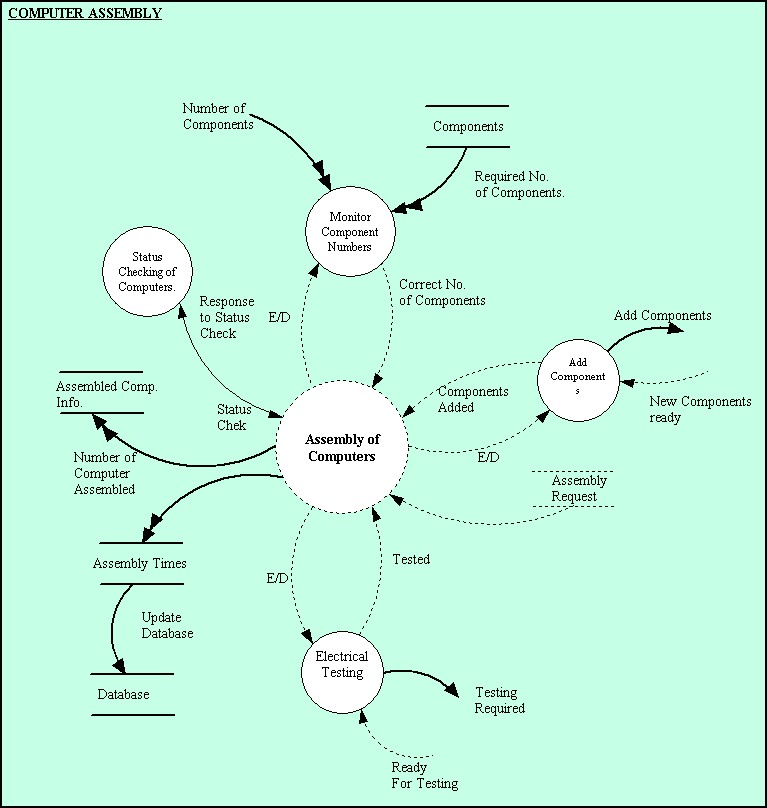
12.2 Software Loading
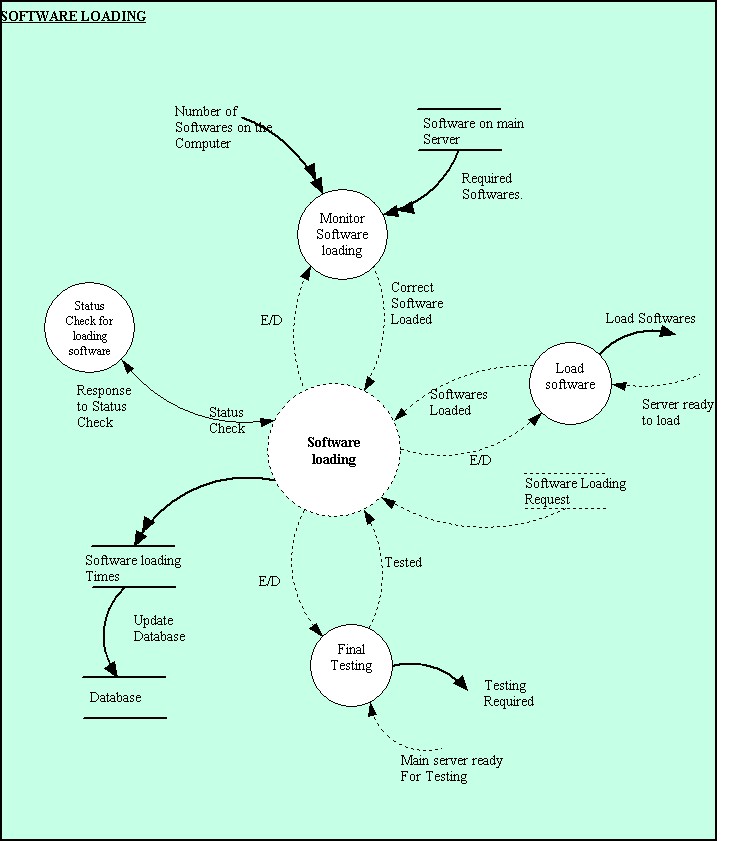
12.3 Distribution and Transportation System
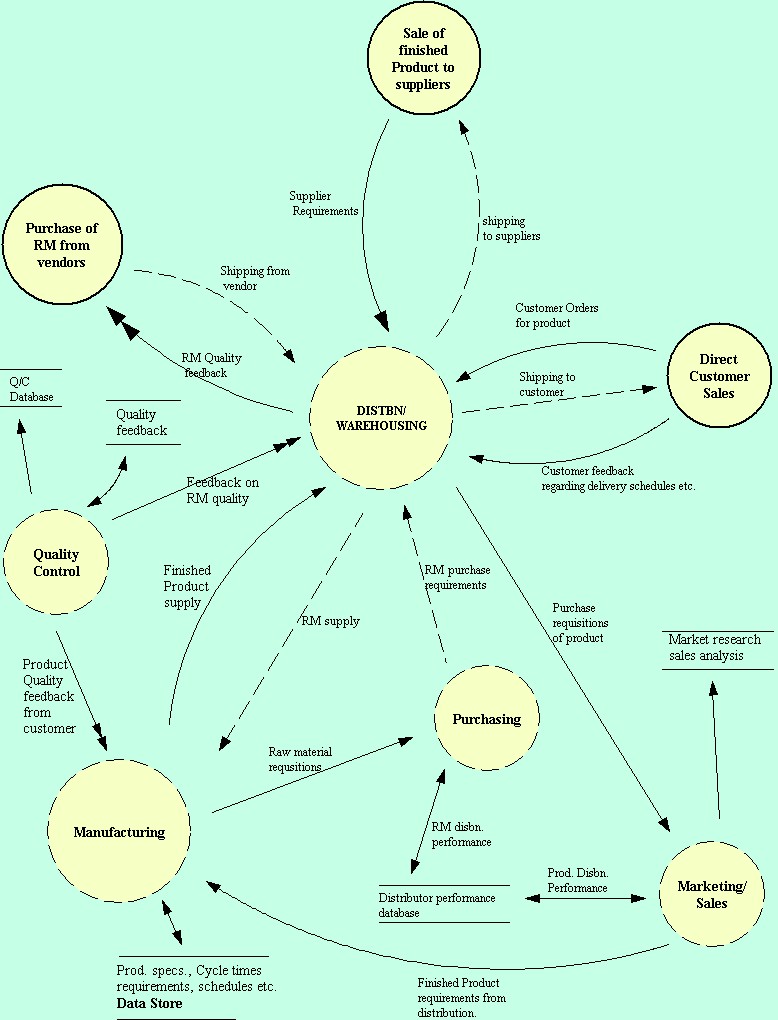
GlOSSARY OF TERMS
ACQUISITION COSTS: these costs include the price of the items, the shopping time, the paper work, expediting (emergency buy, down time), mistakes (returns, rejects, quantity errors; this will generate expediting costs), and the price for internal handling (receiving and storing).
BREAK-BULK CARGO: Cargo, which is, shipped a unit (i.e. Palletized cargo, boxed Cargo, large machinery, trucks and pre-slung cargo).
BULK CARGO: Loose cargo that is loaded directly into a ship's hold.
BULK CARRIER: There are two types of bulk carrier, the dry-bulk carrier and the liquid-bulk carrier better known as a tanker. Bulk cargo is a shipment such as oil, grain, or ore which is not packaged, bundled, bottled, or otherwise packed and is loaded without counting or marking.
BUSINESS PROCESS (BP) : A set of logically related tasks performed to achieve a defined business outcome.
CARRIER(S) CONTAINER(S)/SHIPPER(S) CONTAINER(S): The term Carrier(s) Container(s) or Shipper(s) Container(s) means containers over which the carrier or the shipper has control either by ownership or by the acquisition thereof under lease or rental from container companies or container suppliers or from similar sources. Carriers are prohibited from purchasing, leasing or renting shipper owned containers.
CHANGE ANALYSIS: Study of suitable changes of the activities of an enterprise in concrete situation
CORRUGATED CASES: Built like a sandwich cardboard - characteristic arches of wavy "fluting" lying between two pieces of smooth board on the outside.
CONTAINER: The term container means a single rigid, non-disposable dry cargo, insulated, temperature controlled flatrack, vehicle rack portable liquid tank, or open top container without wheels or bogies attached, having not less than 350 cubic feet capacity, having a closure or permanently hinged door that allows ready access to the cargo (closure or permanently hinged door not applicable to flatrack vehicle rack or portable liquid tank).
CONTAINER SHIP: Ocean going ship designed to carry containers both internally and on deck. Some are self-sustaining.
CONTAINERIZATION: Concept for the ultimate unitizing of cargo used by both steamship lines and air cargo lines. Containers allow a greater amount of cargo protection from weather, damage, and theft.
DATA: Raw information representing events occurring in the organization before they are organized into an understandable and useful form for humans
DATA DICTIONARY: A way of organizing information, which is collected. This information enables one to work out the composition of the data, uniqueness and consistency of names and definitions of terms, and document them in dictionary which all team members can use
DATA FLOW: Data flow on context diagram either represents information produced within or outside the system which is used by outside world or by the system itself
DATA FLOW DIAGRAM: An important technique for modeling high level detail in a process within a system. They highlight the functions of the system and how they use stored information and transfer information between each other.
DATA-ORIENTED WORK: Refers to the development parts whose purpose is to design technical solutions to this specification.
DISTRIBUTION CHANNELS: Methods by which distribution get products to market.
EDI: Electronic Data Interchange; Proprietary systems by which companies share information.
END-USERS: Customers that are served by distribution.
ENTITIES RELATIOINSHIP DIAGRAMS (ERD): A semantic modeling tool used to identify and organize information and to model particular roles of importance to the enterprise and relationships between them
ENTITIES: A class of real world thing whose role of interaction with the enterprise is well defined.
INFORMATION: A derivative from meaningful interpretation of data.
INFORMATION SYSTEM: A set of interrelated components that collect (or retrieve), process, store and distribute information to support decision making and control in an organization.
INFROMATION TECNOLOGY (IT) : This includes the capabilities offered by computers, Software and telecom. The current media by which information is transferred.
HOLDING COSTS: are the interest costs, the storage cost, the control cost (shipping, transportation, security), taxes, insurance, and the shrinkage cost (shipped short or long, stolen, obsolescence).
HUB: A central location to which traffic from many cities is directed and from which traffic is fed to other areas.
MANAGEMENT INFORMATION SYSTEMS (MIS): A division in corporate structure that creates and maintains IS for the management levels of an organization.
OFFICE AUTOMATION SYSTEMS (OAS): Serves the knowledge level of an organization.
PALLET: Load carrying platform to which loose cargo is secured before placing aboard the aircraft.
PERISHABLES: Any cargo that loses considerable value if it is delayed in transportation (Usually refers to fresh fruit and vegetables).
PROBLEM-ORIENTED WORK: In information systems development, refers to the development parts whose purpose is to specify what the information systems will do.
STRADIS (Structured Analysis And Design of Information Systems): follows the Top-down approach (functional decomposition) for analyzing processes./
TOTAL PROCUREMENT COSTS: are the holding costs and the acquisition costs.
TRANSACTION: A performance or management of a business. In the context of distribution, it is all the interactions between manufacturing, distribution and end-users.
TRANSACTION PROCESSING SYSTEMS (TPS): Serves the operational level of an organization.
UNITISATION: The packing of single or multiple consignments into ULDs or pallets.
USER: One who would be accessing an IS interface in order to
gain a knowledge, to apply to a decision making process.