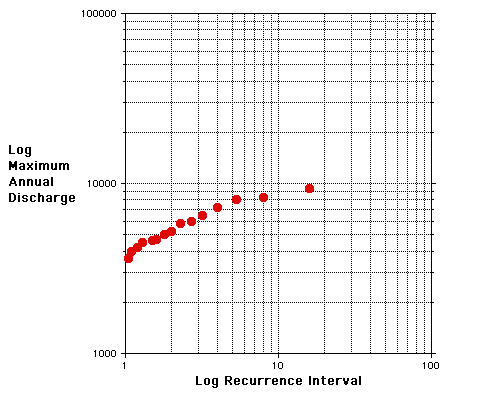
Clearly this is a non linear trend and no straight line would do a satisfactory job of describing the trend. This is a relatively common situation when one examines "real" data. Sometimes there is a transformation that can be applied to one or both of the variables to make the relationship more nearly linear.
Why would that be important? Remember that extrapolation of a linear relationship is straightforward. Also, however, remember that one always needs to justify any extrapolation.
Note how spread out the larger values of RI are relative to the smaller values. It is usually easier to fit a line (by eye) when the data are close together. Sparse data may pose a problem. Recall that the spread of RI values is forced by the Weibull equation.
When one (or more) or the variables exhibits considerable variation a logarithmic (log) transformation may be help "linearize" the data.
A logarithm is defined as an exponent.
102 = 100
where 10 is the base of the logarithm.
log10(100) = 2
That is, one can ask the question .... 10 to what power equals 100?
The power is the logarithm. We will use Log for Log10.
Any positive number can be used as the base of a logarithm.
LogX (100) = ____
That is, X to what power is equal to 100?
The log of a zero or a negative number is undefined.
Consider the following examples:
log (1) = 0
log (10) = 1
log (100) = 2
log (1000) = 3
log (10000) = 4
If we plot the log of Recurrence Interval, the distances between 0 and 1, 1 and 10, 10 and 100, 100 and 1000 etc. are identical (look at the coordinates of some graph paper where both axes are on a log scale). Thus a log transformation compresses the data. The larger the values, the greater the compression. If log of Recurrence Interval is plotted against Discharge on a linear scale the plot is called a semi-log plot. If the logarithms of both variables are plotted the plot is called a log-log plot.
0.1 can be written as:
What is the Log of .1?
Consider log2. What is log2 of 8?
Watch the following short Log-Log Animation to make sure that you can read the coordinates on a log scale.
A complete log-log plot for the Hypothetical River data plotted above is given below.

Note that the plot more nearly depicts a linear relationship.
You have a chance to by a wonderful piece of property on the Hypothetical River. A neighbor tells you that your Kumquat Orchard will be underwater if there is an event with a discharge of 5,000 cfs or higher. According to the above plot this should happen about
Therefore, what is the probabilty that such an event should occur each year?
You know that planners refer to something called the 100-Year Flood that is defined from a plot of Recurrence Interval versus Maximum Annual Discharge. This is a flood with a recurrence interval of 100 years. As a potential owner of property near the banks of the Hypothetical River are you comfortable assuming that the 100 - Year Flood will have a discharge of 9,400 cfs?
Using a sheet of paper as a straight edge, carefully position a best fit straight line on the plot given above. Estimate the discharge for an event with a recurrence interval of 100 years.
Think about why you might not be comfortable in extrapolating the 100 year recurrence interval from a data set covering 15 years. What if the land use changed? What might happen?
Return