GPR data processing for 3D fracture mapping in a marble quarry (Thassos, Greece)
BRGM, BP 6009 45060 Orléans, France
Abstract
Ground Penetrating Radar (GPR) has been successfully applied to detect and map fractures in marble quarries. The aim was to distinguish quickly intact marketable marble areas from fractured ones in order to improve quarry management. The GPR profiling method was chosen because it is non destructive and quickly provides a detailed image of the subsurface. It was performed in domains corresponding to future working areas in real quarry-exploitation conditions. Field surveying and data processing were adapted to the local characteristics of the fractures: E-W orientation, sub-vertical dip, and karst features. After the GPR profiles had been processed, using methods adapted from seismics (amplitude compensation, filtering and Fourier migration), the interpreted fractures from a 12 x 24 x 15 m zone were incorporated into a 3D model. Due to the low electrical conductivity of the marble, GPR provides penetration depths of about 8 and 15 m, and resolutions of about 1 and 5 cm for frequencies of 900 and 300 MHz respectively. The detection power thus seems to be sufficient to recommend use of this method. As requested by the quarriers, the 3D representation can be used directly by themselves to locate high- or low-quality marble areas. Comparison between the observed surface fractures and the fractures detected using GPR showed reasonable correlation.
Since December 1, 1996
Figure 1 Thassos marble quarry location map. The study area is represented by the grey square.


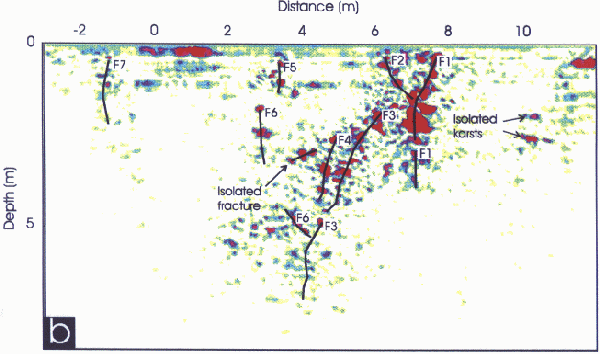
Figure 2b: GPR data of figure 1a after processing including amplitude compensation, frequency filtering, FK powering, migration and image enhancement. All fractures appear as diffracting points (in red) because they are composed by karstic events.

Figure 3: 3D fracture field reconstructed from 300 MHz GPR profiles after all picked fractures have been correlated from profiles to others.

REFERENCES:
G.Grandjean and J.C.Gourry, 1996. GPR data processing for 3D fracture mapping in a marble quarry (Thassos, Greece). App. Geophys., Vol 36/1, pp19-30.