I wanted to pass along a graphic description of one tailed tests and
some information regarding using Mathematica to do one-tailed tests. The description
applies for small and large samples.
Why would you want to use a one tailed test?
To find out if the true parameter (e.g., mean, proportion,
difference in means, differences in proportions) is greater than or less than a value.
Here is one possible null hypothesis.

It is saying that the population mean for the sample is greater than zero. The alternative hypothesis is

Suppose you want to test the research question that cities in the
south have experienced positive growth since 1980. Any sample of southern cities would
come from a population distribution with a mean value greater than zero. The alternative
hypothesis to the null is that the population distribution contains a mean value less than
or equal to zero.
Suppose you want to compare growth in the northeast and the south. You believe that northeast cities have experience negative growth (cities have lost population) while southern cities have experienced positive growth. The difference between the mean growth rate of southern cities should be greater than the mean growth rate of northeast cities. The null hypothesis is:

The alternative hypothesis is

What are the rejection regions for a one-tailed test?
The rejection region corresponds to the alternative hypothesis.
Suppose you want to find the rejection region for the question regarding population growth
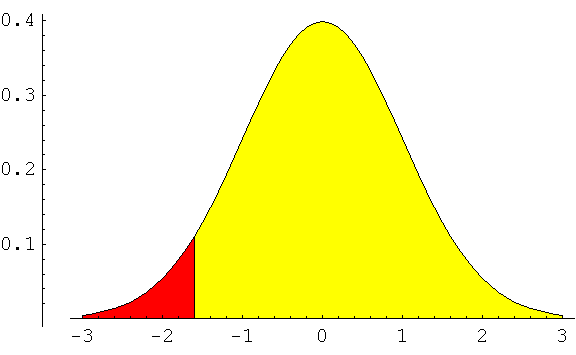
in southern and northest cities. The graph would look like this

To reject the null, the tail used for the rejection region should cover the extreme values
of the alternative hypothesis - the area in red. The z or t score is negative and less
than the score set for the rejection condition.
Suppose the null hypothesis was the following

Growth the Midwest was less than the growth in the Northeast. The alternative hypothesis is

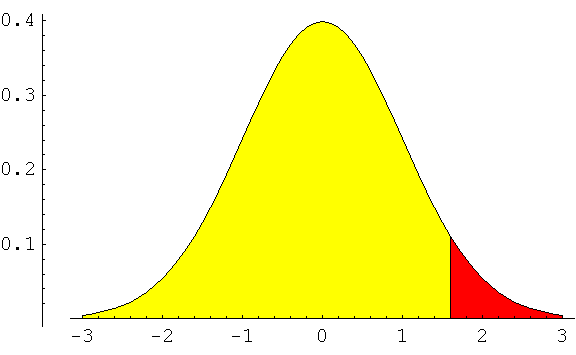
The graph showing the rejection region for this problem is below.

The t or z scores that are rejected are ones in the red region or positive values.
| If the null hypothesis states | then the test statistics (z score or t score) that rejects it is always |
| population parameter is greater than zero (or a constant) | negative and less than the score set for the rejection condition. |
| population parameter is less than zero (or a constant) | positive and greater than the score set for the rejection condition. |
Mathematica and one-tailed test.
Mathematica does not ask if the population parameter being
considered is less than or greater than D. If the t or z score is exteme, it will report
that the null is rejected - this report may be incorrect for your research
question.
Example: You want to test if the mean growth rate
for southern cities is greater than northeast cities (or the difference of the means is
greater than zero). Rejection region is in the negative section of the z (standard normal)
distribution. You compute the z score and it is 3.00, clearly in the right tail in the
exterme region. Again, your rejection region is negative so you should fail to reject the
null. Mathematica reports that the null is rejected. This is not correct for your
research question.
To double check mathematica's answer, compare the value of the test statistics to the information in the table. It is important to look at the sign of the value of the test statistics.