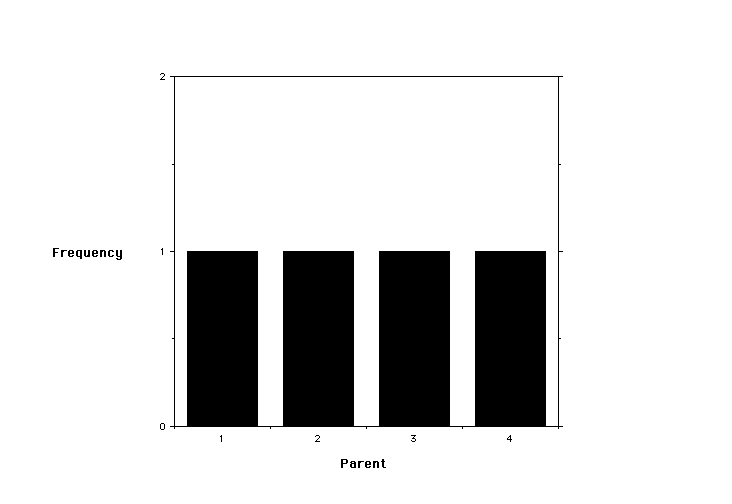

A population consists of four values -- 1, 2, 3, and 4. The mean of the distribution is 2.5. The population has a uniform distribution.

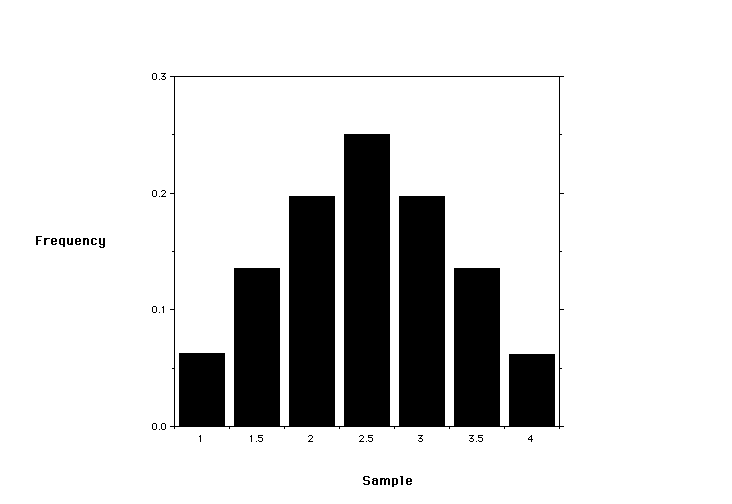
Two samples are drawn and their mean is taken and recorded. What is the distribution of the sample means?
The sample space is given below. Think of the columns as recording the first draw and the rows as the second draw. After making a draw, the ticket is returned to the bin -- sampling with replacement.
| 1 | 2 | 3 | 4 | |
|---|---|---|---|---|
| 1 | 1,1 | 1,2 | 1,3 | 1,4 |
| 2 | 2,1 | 2,2 | 2,3 | 2,4 |
| 3 | 3,1 | 3,2 | 3,3 | 3,4 |
| 4 | 4,1 | 4,2 | 4,3 | 4,4 |
The means for each cell in the sample space are given below.
| 1 | 2 | 3 | 4 | |
|---|---|---|---|---|
| 1 | 1.0 | 1.5 | 2.0 | 2.5 |
| 2 | 1.5 | 2.0 | 2.5 | 3.0 |
| 3 | 2.0 | 2.5 | 3.0 | 3.5 |
| 4 | 2.5 | 3.0 | 3.5 | 4.0 |
The distribution of sample means is given below.
| Mean | Frequency |
|---|---|
| 1 | 1/16 |
| 1.5 | 2/16 |
| 2.0 | 3/16 |
| 2.5 | 4/16 |
| 3.0 | 3/16 |
| 3.5 | 2/16 |
| 4.0 | 1/16 |

The Central Limit Theorem
If a variable x has a distribution with mean u and standard deviation s, then the sampling distribution of the sample means based on random samples of size N will have a mean equal to u, and a standard deviation of : s = sx/N 1/2 ... the standard error of the mean and will tend to be normal in form as the sample size becomes large. In other words, even though the parent distribution was uniform, the sample means will tend to be normally distributed.
There is nothing to be handed in but you should spend about 30 minutes with the following exercise.
Try the sampling distribution applet.
Remember that the fourth window is plotting the sample standard deviations and not the standard error of the means. Compare the mean of these values with the known standard deviation.
There is nothing to hand in. Spend time experimenting and thinking about the implications for sampling a target population.