Harris County 2016 Election Survey
The Hobby School of Public Affairs at the University of Houston completed live telephone interviews with 400 registered voters in Texas who reported they were certain (77 percent) or very likely to vote (23 percent) on or before election day on November 8, 2016.
Interviews were conducted by Consumer Research International between October 7 and October 15, 2016 on landline phones (54 percent) and cell phones (45 percent).
The margin of error for the survey is +/- 4.5 percent (at the 95 percent confidence level). The survey was conducted under the supervision of co-directors Richard Murray, director of the Hobby School’s Survey Research Institute, and Robert Stein, research associate at the Hobby School.
The sample was weighted to reflect the racial and ethnic composition of the electorate based on the 2008 and 2012 presidential elections.
A. Presidential Candidate Support in Harris County
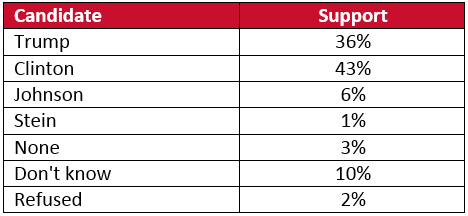
- Hillary Clinton leads Donald Trump by 7 points in the presidential election among Harris County voters.
- The Clinton lead of 7 percent is statistically significant.
- Third party candidates Johnson and Stein are receiving 7 percent of the vote.
- Since 2008, no presidential candidate has carried Harris County with more than 2 percent of the popular vote.
B. Presidential Candidate Support by Partisan Identification
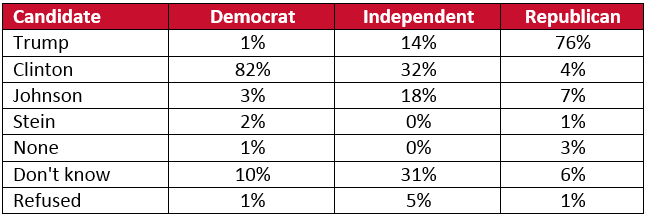
- Eighty-two percent of self-identified Democratic voters are voting for Clinton, compared to 76 percent of self-identified Republicans who are voting for Trump.
- Among Republican voters, 4 percent are voting for Clinton while 1 percent of Democratic voters are voting for Trump.
- Ten percent of Democrats are undecided about who to vote for in November’s presidential contest. Only 6 percent of Republicans are undecided.
- Almost a third (31 percent) of all independents are undecided about who they will vote for in the presidential contest.
- Third party candidate Johnson is receiving 18 percent of the independent vote.
- Among independents, Clinton leads Trump 32 percent to 14 percent.
- Forty-three percent of Johnson’s supporters identify themselves as ‘leaning Republicans.’
C. Presidential Candidate Support by Gender
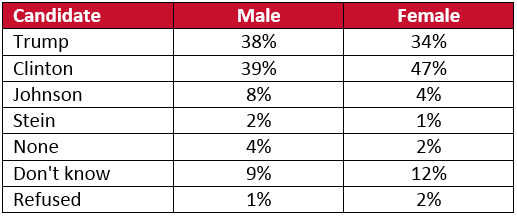
- Women support Clinton's candidacy over Trump by 47% to 34%.
- Males support Clinton's candidacy over Trump by 39% to 38%
D. Support for Presidential Candidates by Likelihood of
Voting in November’s Election
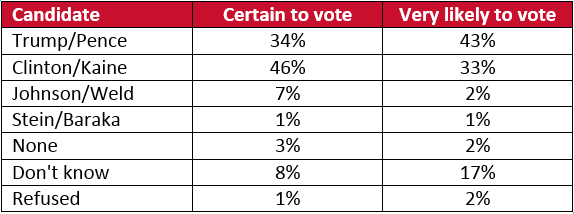
- Clinton leads Trump by 12 percentage points among voters who are certain to vote in this November’s election.
- Trump leads Clinton by 10 percentage points among voters who are very likely to vote in this November’s election.
E. How would you rate Donald Trump and Hillary Clinton?
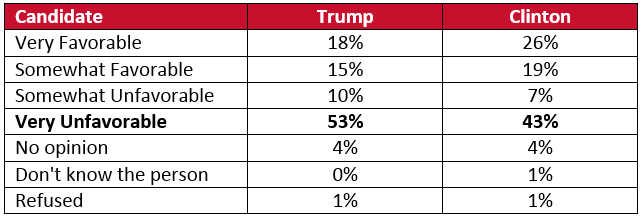
- Clinton is rated very unfavorably by 43 percent of Harris County voters.
- Trump is rated very unfavorably by 53 percent of Harris County voters.
F. Who do you think will be the next president of the United States?
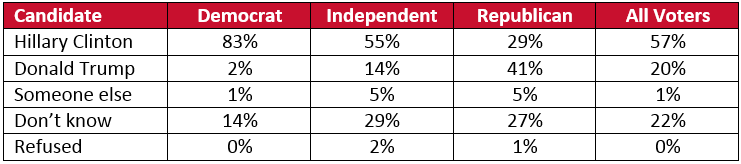
- Fifty-seven percent of Harris County voters believe Hillary Clinton will be our nation’s next president. Only 29 percent of Harris County voters believe Donald Trump will be elected president.
- Twenty-nine percent of Republican voters in Harris County believe Hillary Clinton will be elected President; only 41 percent believe Donald Trump will be elected President.
G. Who do you think carry Harris County in the presidential election?
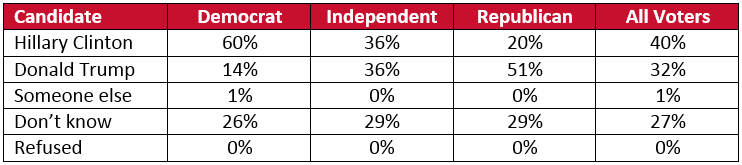
- Forty percent of Harris County voters believe Hillary Clinton will carry the county while 32% believe Donald Trump will carry the county.
H. Vote Choice in Harris County District Attorney Election
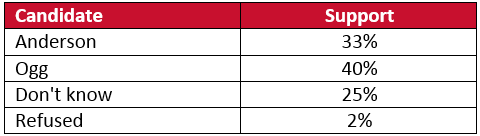
- Democrat Kim Ogg leads incumbent Republican Devon Anderson by 7 percentage points in the race for Harris County District Attorney.
I. Vote Choice in Harris County District Attorney Election by Party Identification
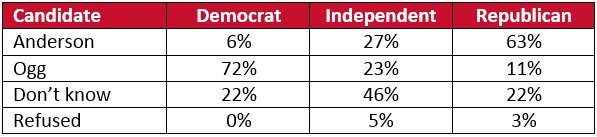
- Sixty-three percent of Republican voters are voting for Anderson.
- Seventy-two percent of Democratic voters are voting for Ogg.
- Eleven percent of Republicans are voting for Ogg, 6 percent of Democrats are voting for Anderson.
J. Vote Choice in Harris County Sheriff Election
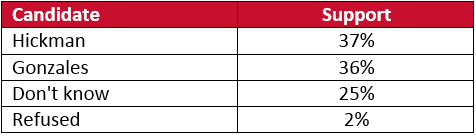
- Incumbent Republican Harris County Sheriff Ron Hickman is statistically tied with his Democratic challenger Ed Gonzales. Hickman leads Gonzales by 1 percent point.
K. How frequently do persons vote illegally?
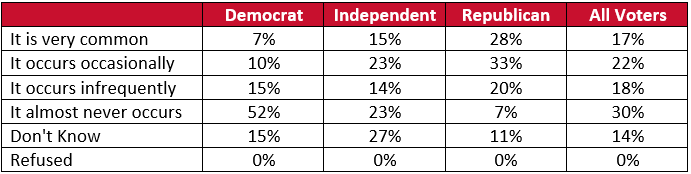
- Seventeen percent of Harris County voters believe it is very common that people in Texas who are not legally eligible to vote are indeed voting.
- Thirty percent of Harris County voters believe illegal voting almost never occurs.
- Nearly two-thirds (61 percent) of Republican voters are more likely to believe that persons voting illegally is either very common or occurs occasionally.
- Fifty-two percent of Democratic voters believe persons voting illegally almost never occur.
L. Is a government issued photographic ID required to vote in Texas?
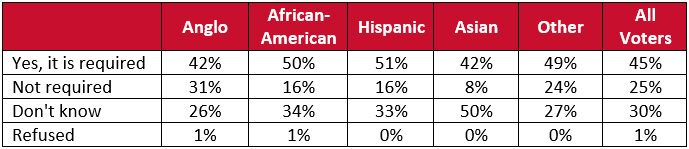
- Twenty-five percent of registered voters in Harris County correctly know that a government issued photo ID is not required to vote in this November’s Texas election.
- Forty-five percent of voters in Harris County incorrectly believe a government issued photographic identification is required to vote in this November’s presidential election in Texas.
- Thirty percent of voters don’t know if a photo ID is required to vote.
- A majority of African-American and Hispanic voters incorrectly believe that a government issued photo ID is required to vote in this November’s election.
In the Media
Chron: New poll shows Democrat gains in Harris County
Houston Chronicle: Confusion feared as polls open today